JET-CALF / Boeing–NSERC Micro-Turbojet Research
Graduate researchJET-CALF (Jet Contrails from Aviation Lubricants and Fuels) is a multi-institution program on how fuels and lubricants affect aircraft emissions and contrails. I lead the micro-turbojet performance and gaseous-emissions task, and I coordinate the UBC experimental work for JET-CALF, SCALE-SAF and VLAME. Back-to-back tests on a JetCat P200-SX compare fuel use, gaseous emissions and particles for Jet A-1 and FT-SPK. Each result below belongs to one campaign on this one engine.
WhatWhy a micro-turbojet
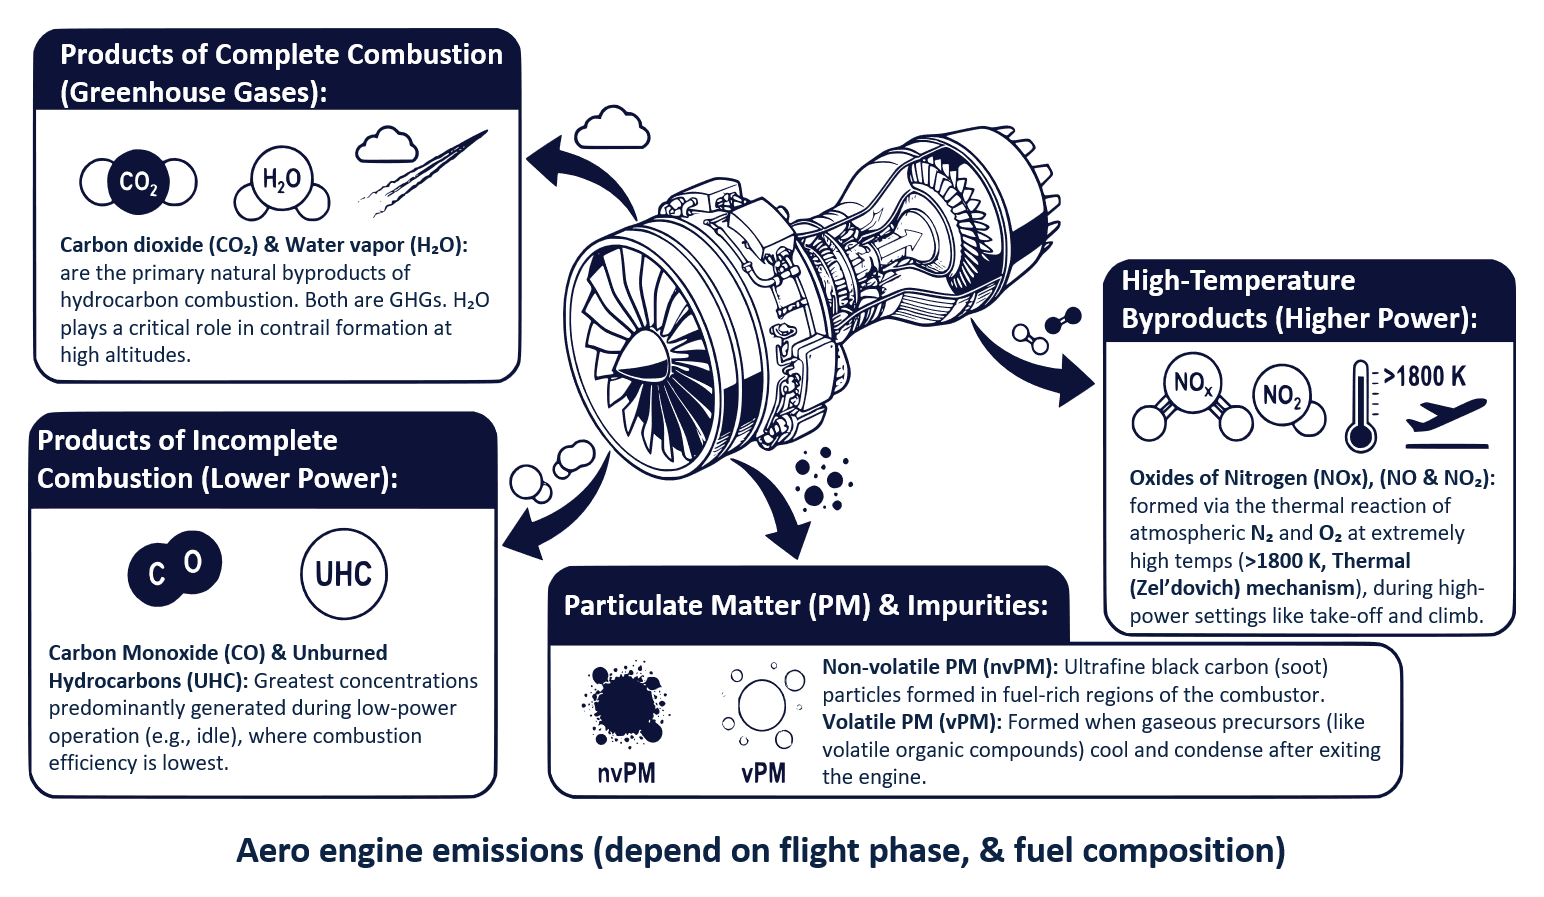
Sustainable aviation fuels are drop-in fuels, but they do not all burn the same way. Their composition changes evaporation, mixing, reaction rates and heat release. Measurements on a full-scale turbofan are slow, regulated and expensive. As a result, fuel effects are usually seen only at a few certification points [1]. The Research page explains why a micro-turbojet is a useful platform for this work.
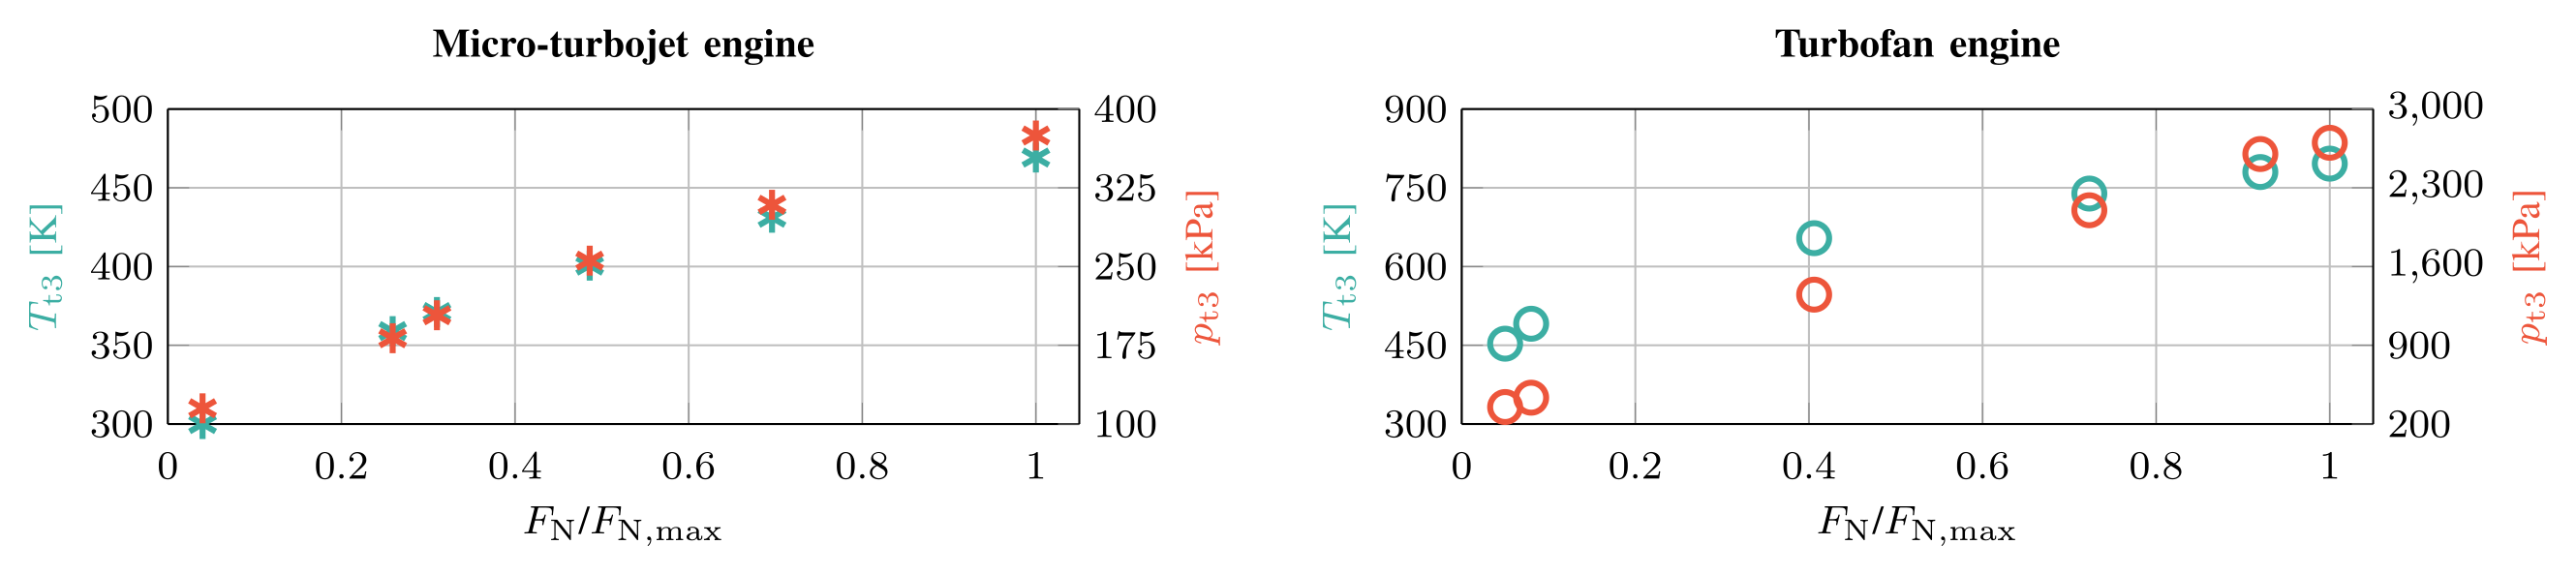
The rig is useful at one selected comparison point. At maximum thrust, the P200-SX reaches a combustor-inlet temperature and pressure close to those of a V2500 turbofan at idle. We call this the “micro-max, macro-idle” comparison [1, 2].
The match is in the combustor-inlet state only. Residence time, mixing, pressure-ratio range and the lubricant input still differ. The small engine is therefore not a scale model of the turbofan [1].
| Operating point | \(T_{t3}\) | \(p_{t3}\) | OPR | Fuel flow |
|---|---|---|---|---|
| P200-SX at max thrust | 469 K | 374.8 kPa | ≈ 4 | 0.0103 kg/s |
| V2500 at idle | 453 K | 351 kPa | ≈ 3.5 | 0.0988 kg/s |
WhatProgram and team
Boeing and NSERC fund JET-CALF. The program connects UBC, TU Braunschweig (IFAS), Tampere University and Sungkyunkwan University. The partners share the work as follows:
- UBC. The micro-turbojet supplies controlled, repeatable fuel comparisons.
- TU Braunschweig. The team couples these comparisons to an engine-performance model and a chemical reactor network.
- Tampere. The team brings particle and aerosol expertise.
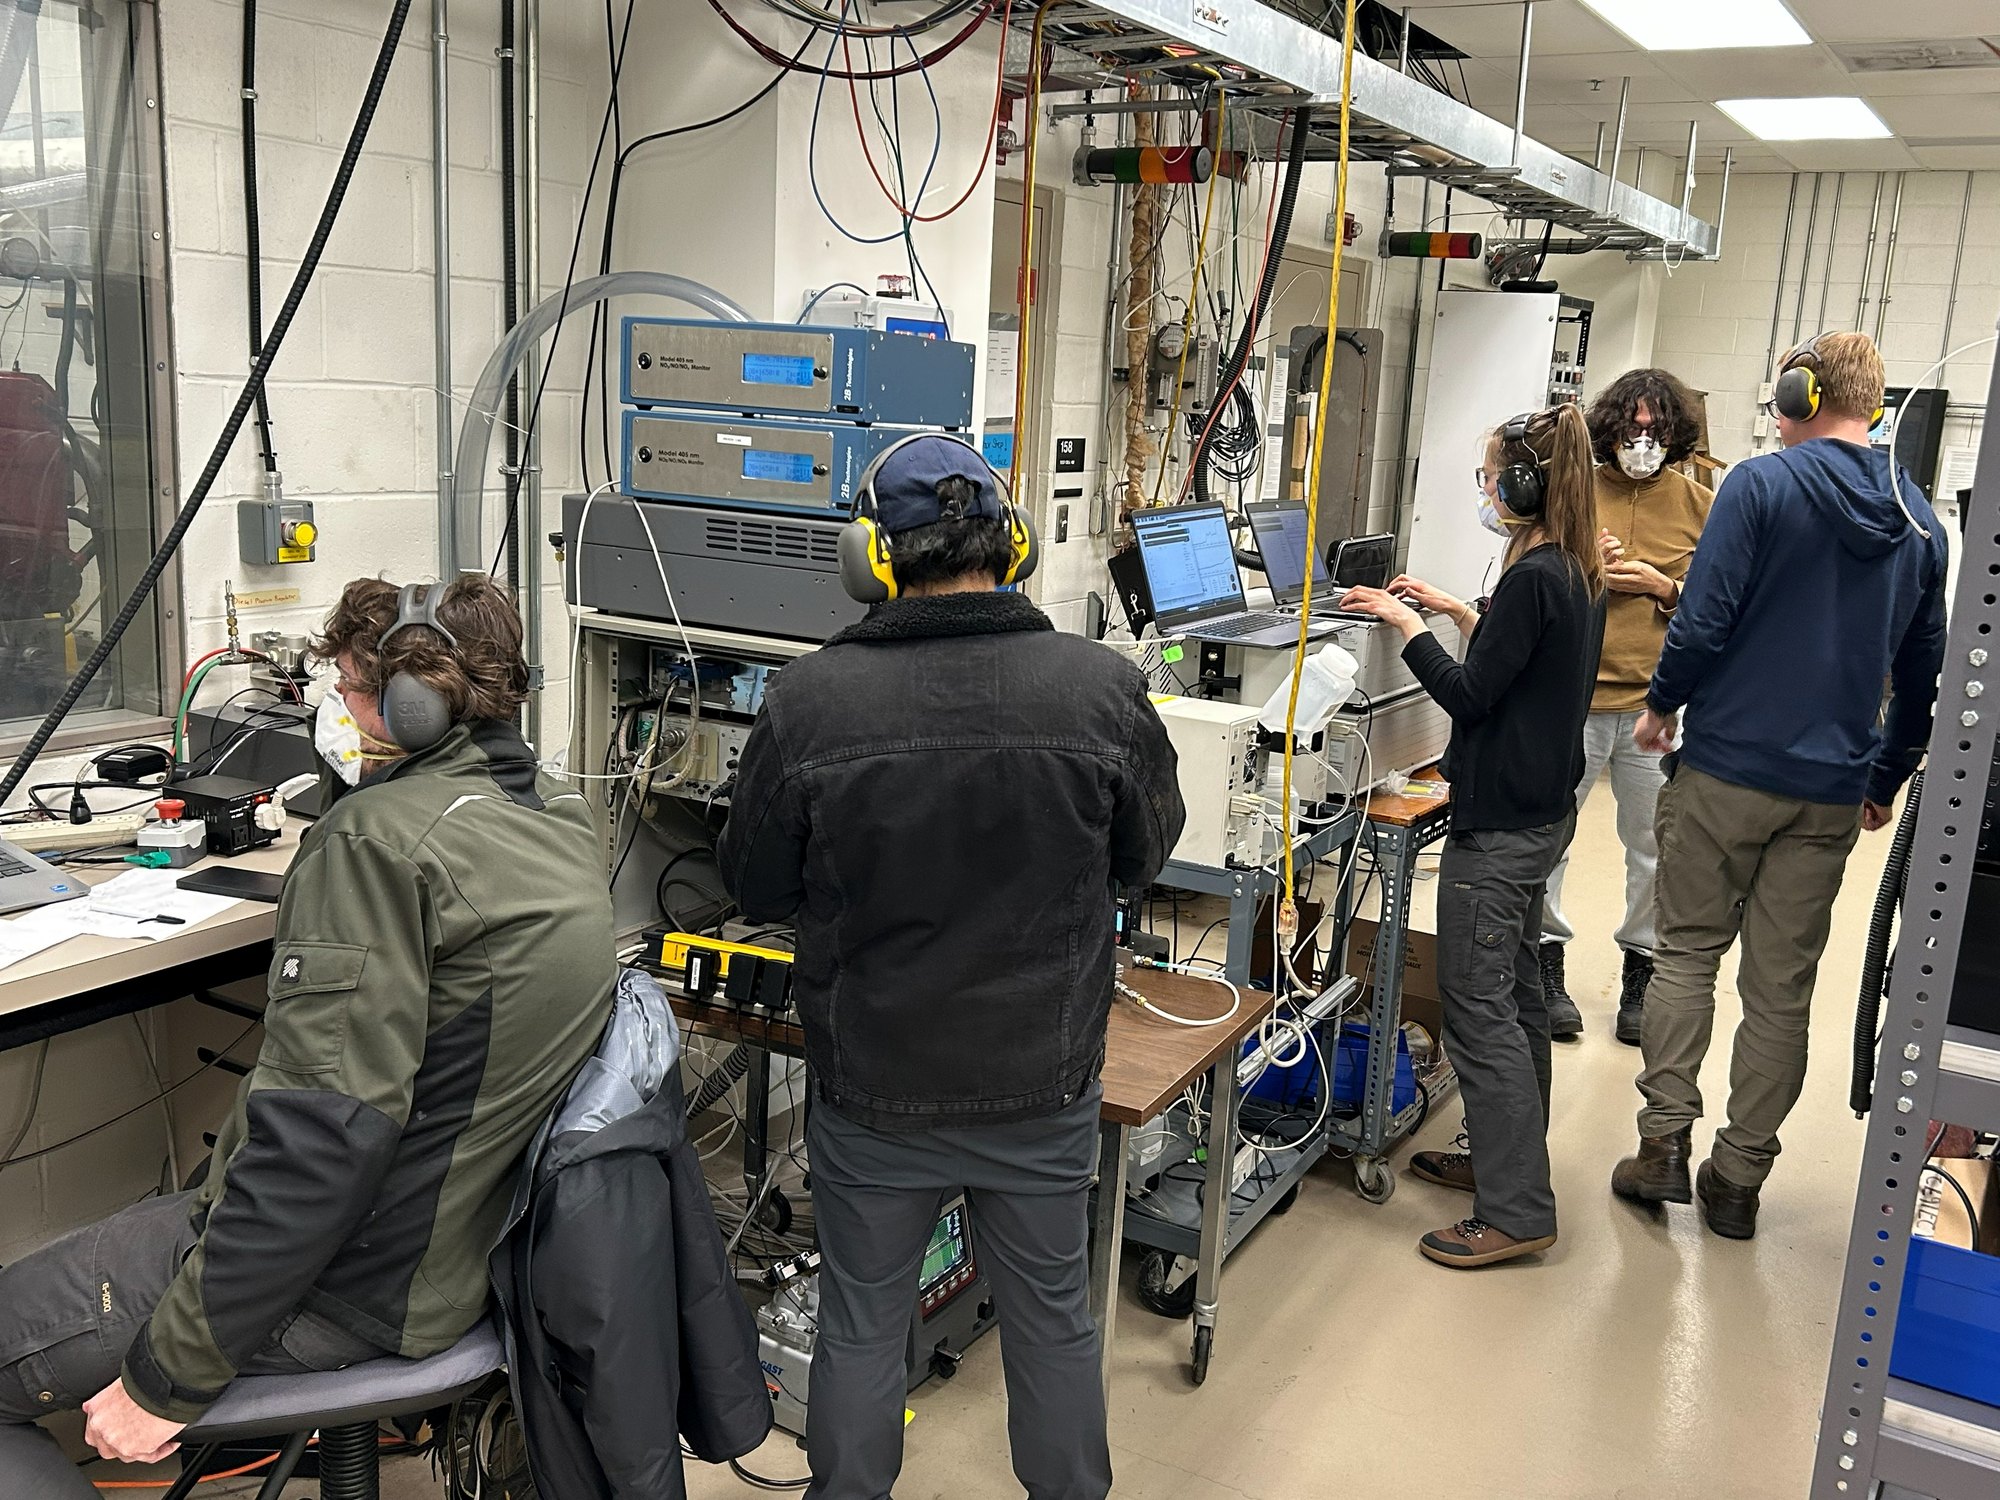
I lead the micro-turbojet task. I plan and run the campaigns, make the performance and gaseous-emissions measurements, and do the data reduction and uncertainty analysis. I also supply the measured engine state that calibrates the CRN model [3].
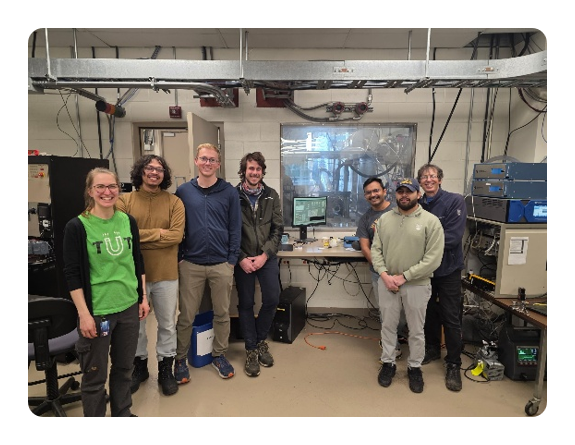
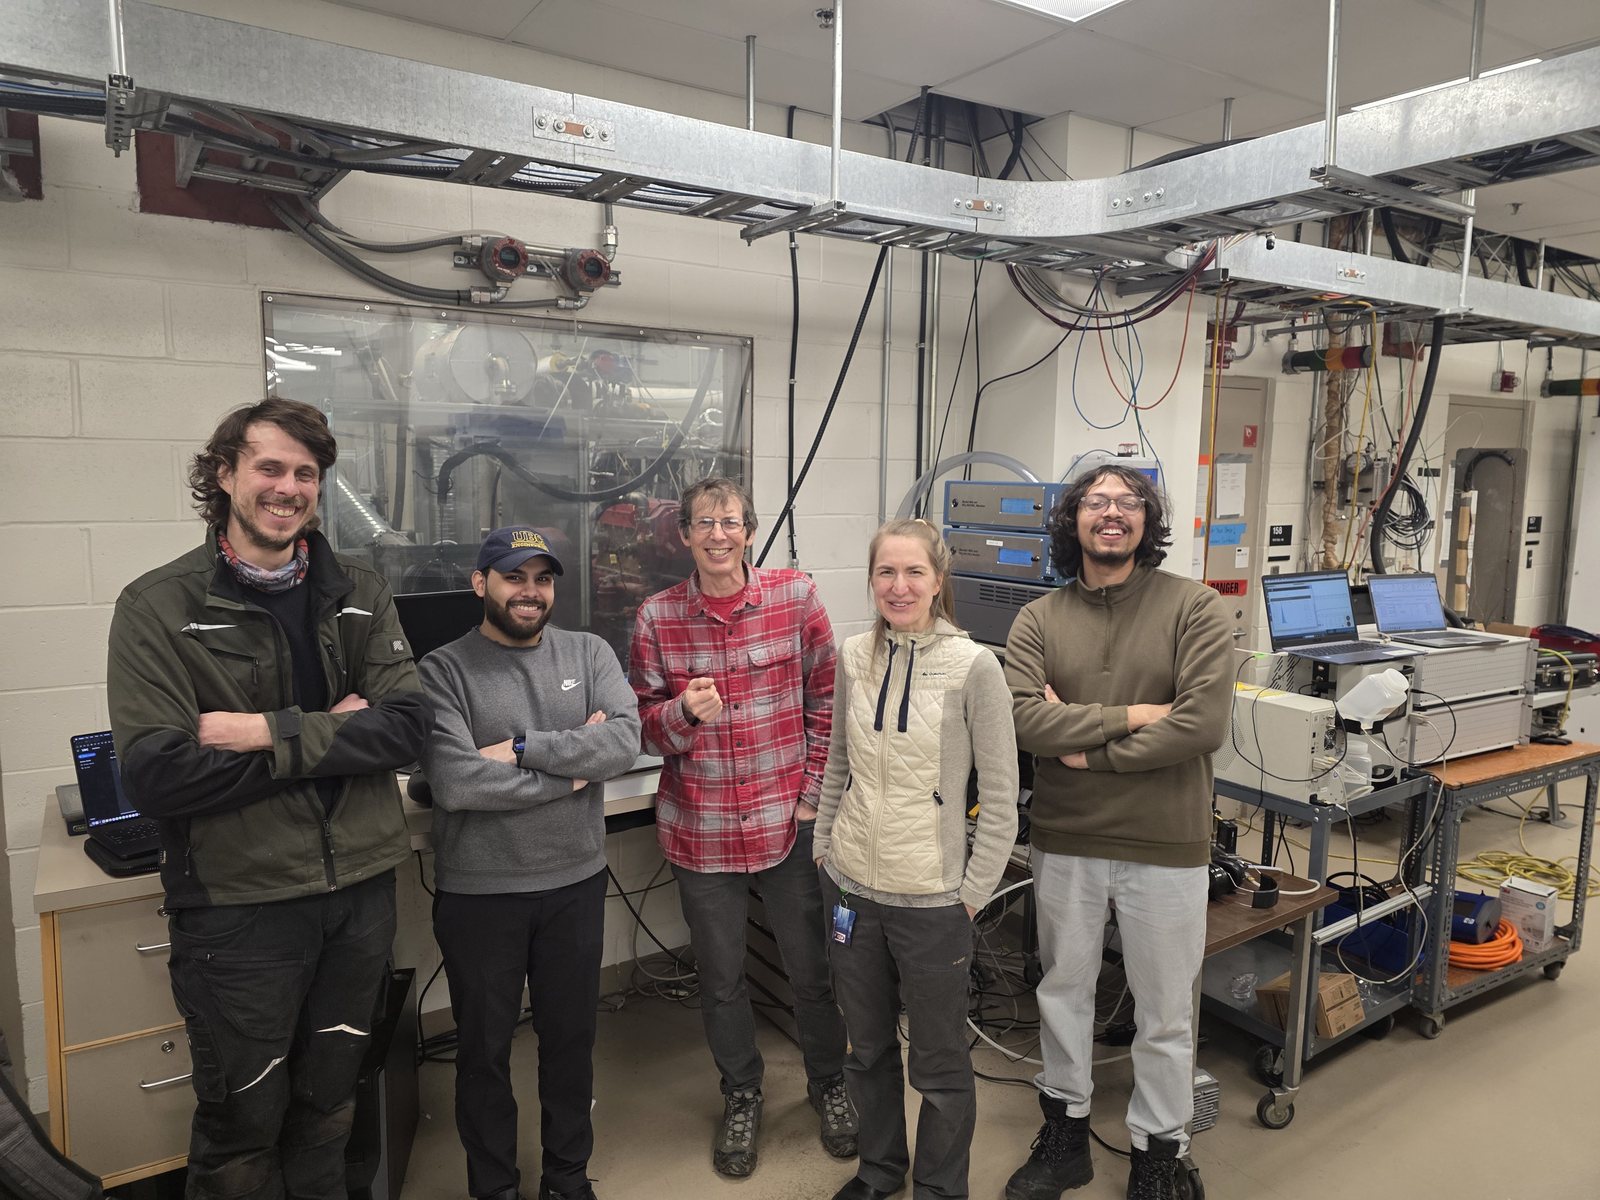
Jan Göing of TU Braunschweig joined us at UBC on a research stay. Together we made the alternative-fuel measurements on our engine at UBC. The IFAS institute reported the work in its news, in German: Analyse des Einflusses alternativer Kraftstoffe auf Performance und Emissionen ↗.
HowBack-to-back fuel testing
We test the fuels one after the other, on the same day and engine, at the same operating points. This keeps engine-to-engine and day-to-day effects small, so the remaining difference is mainly the fuel. Full-scale campaigns struggle to make that comparison.
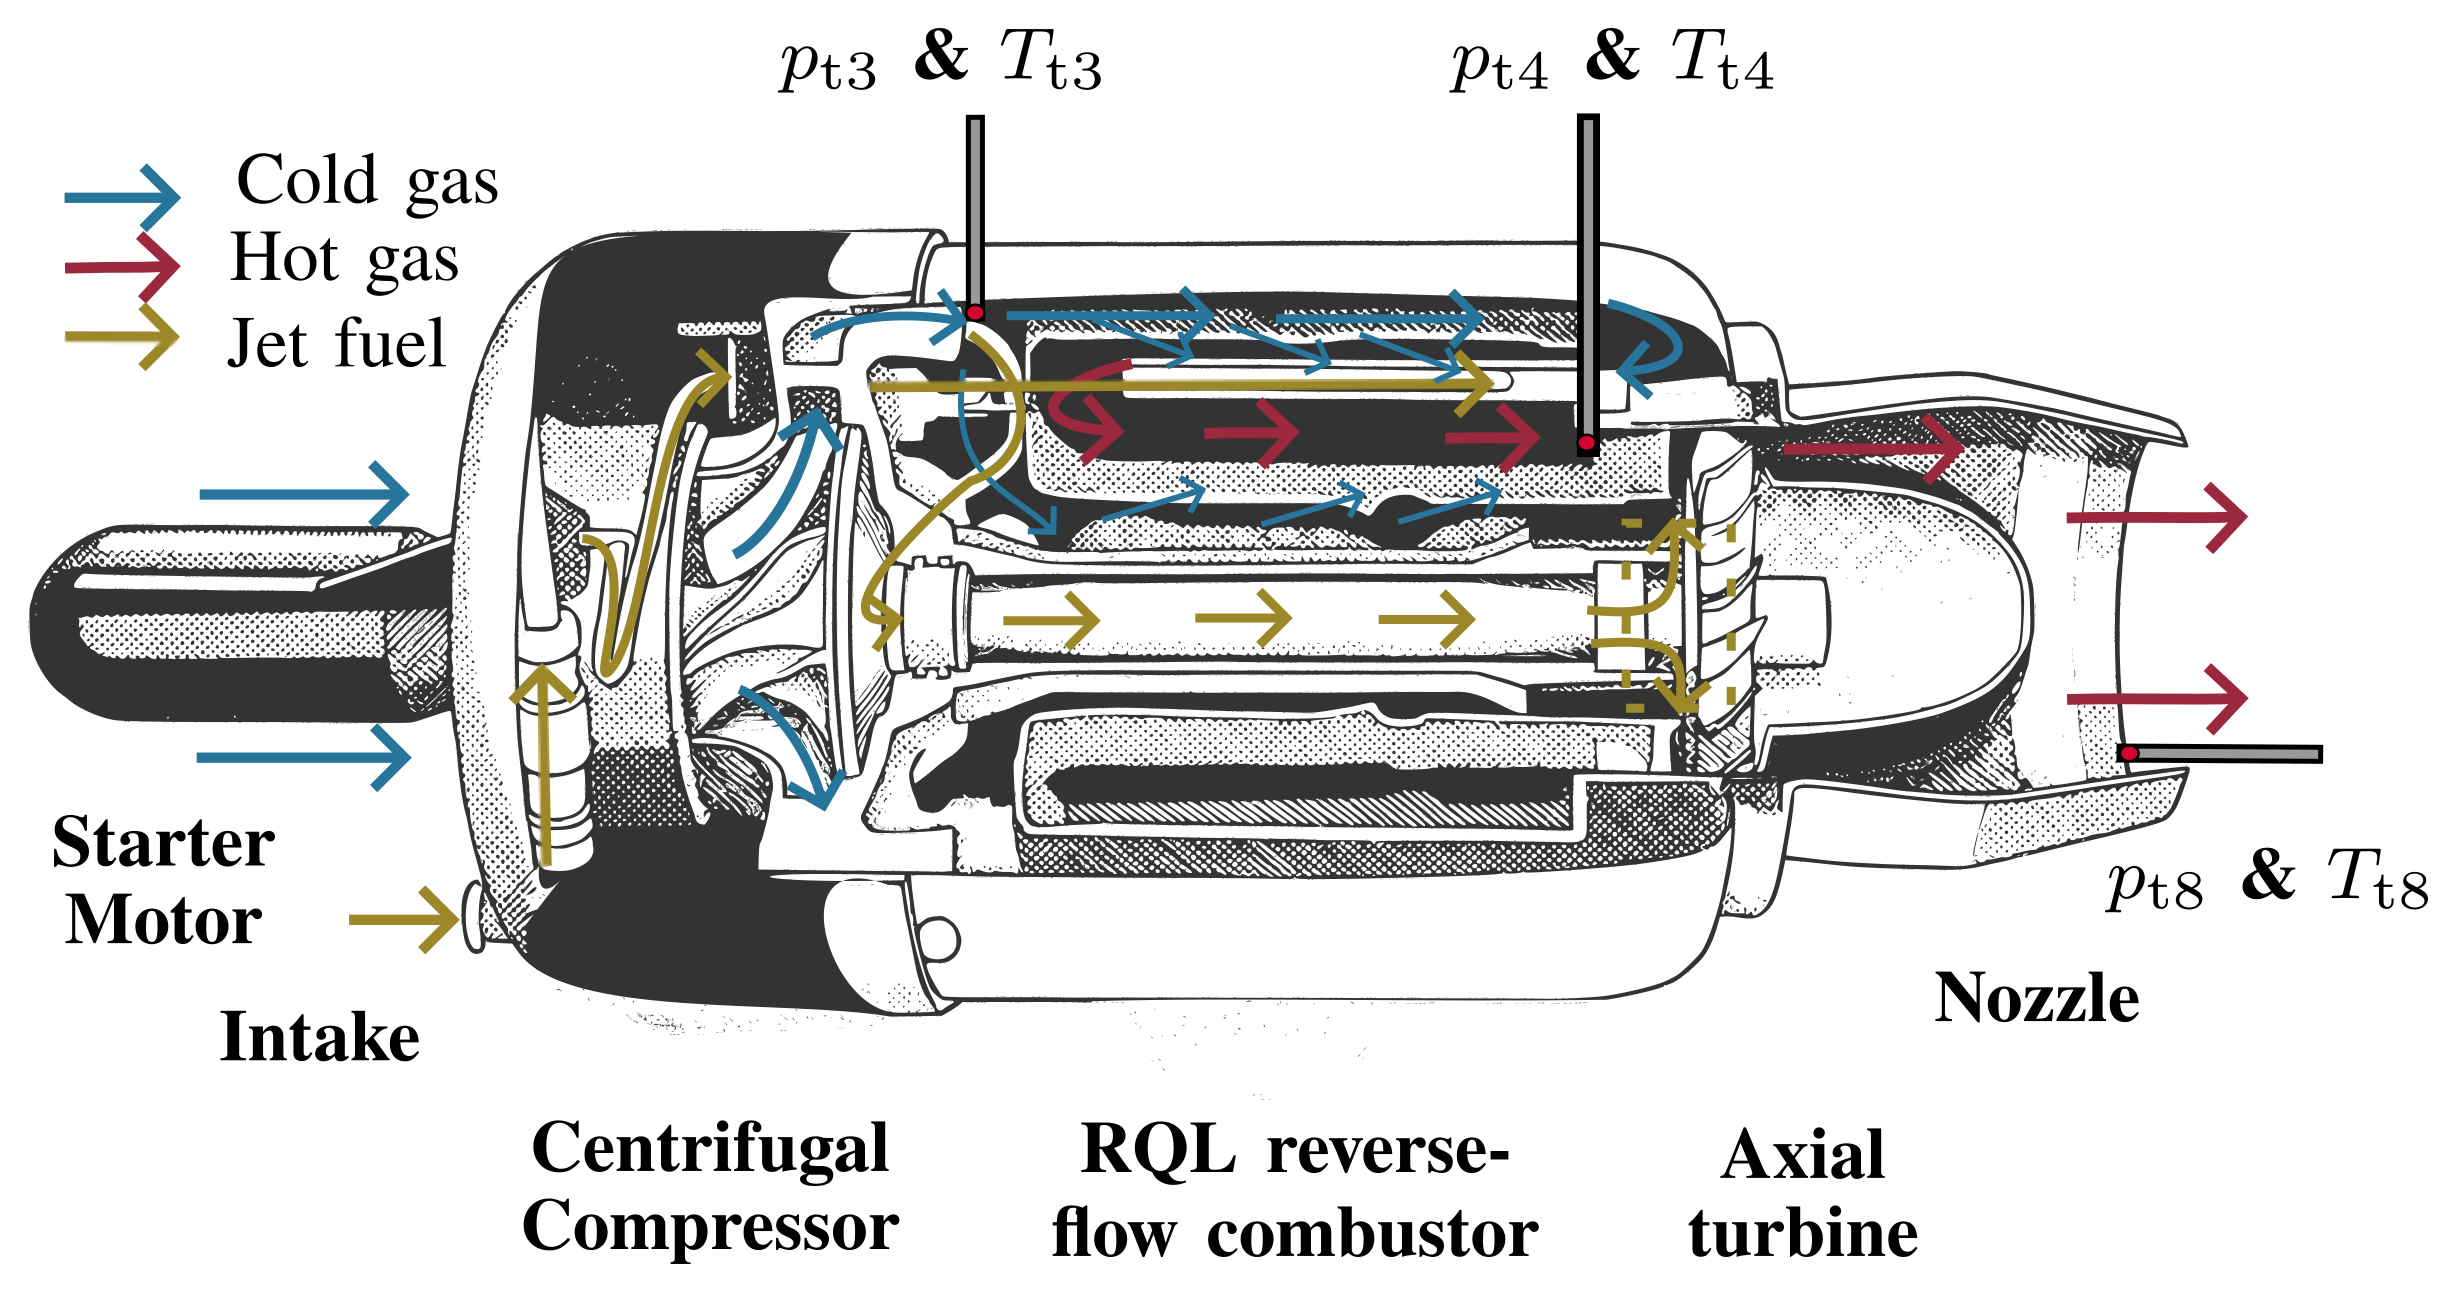
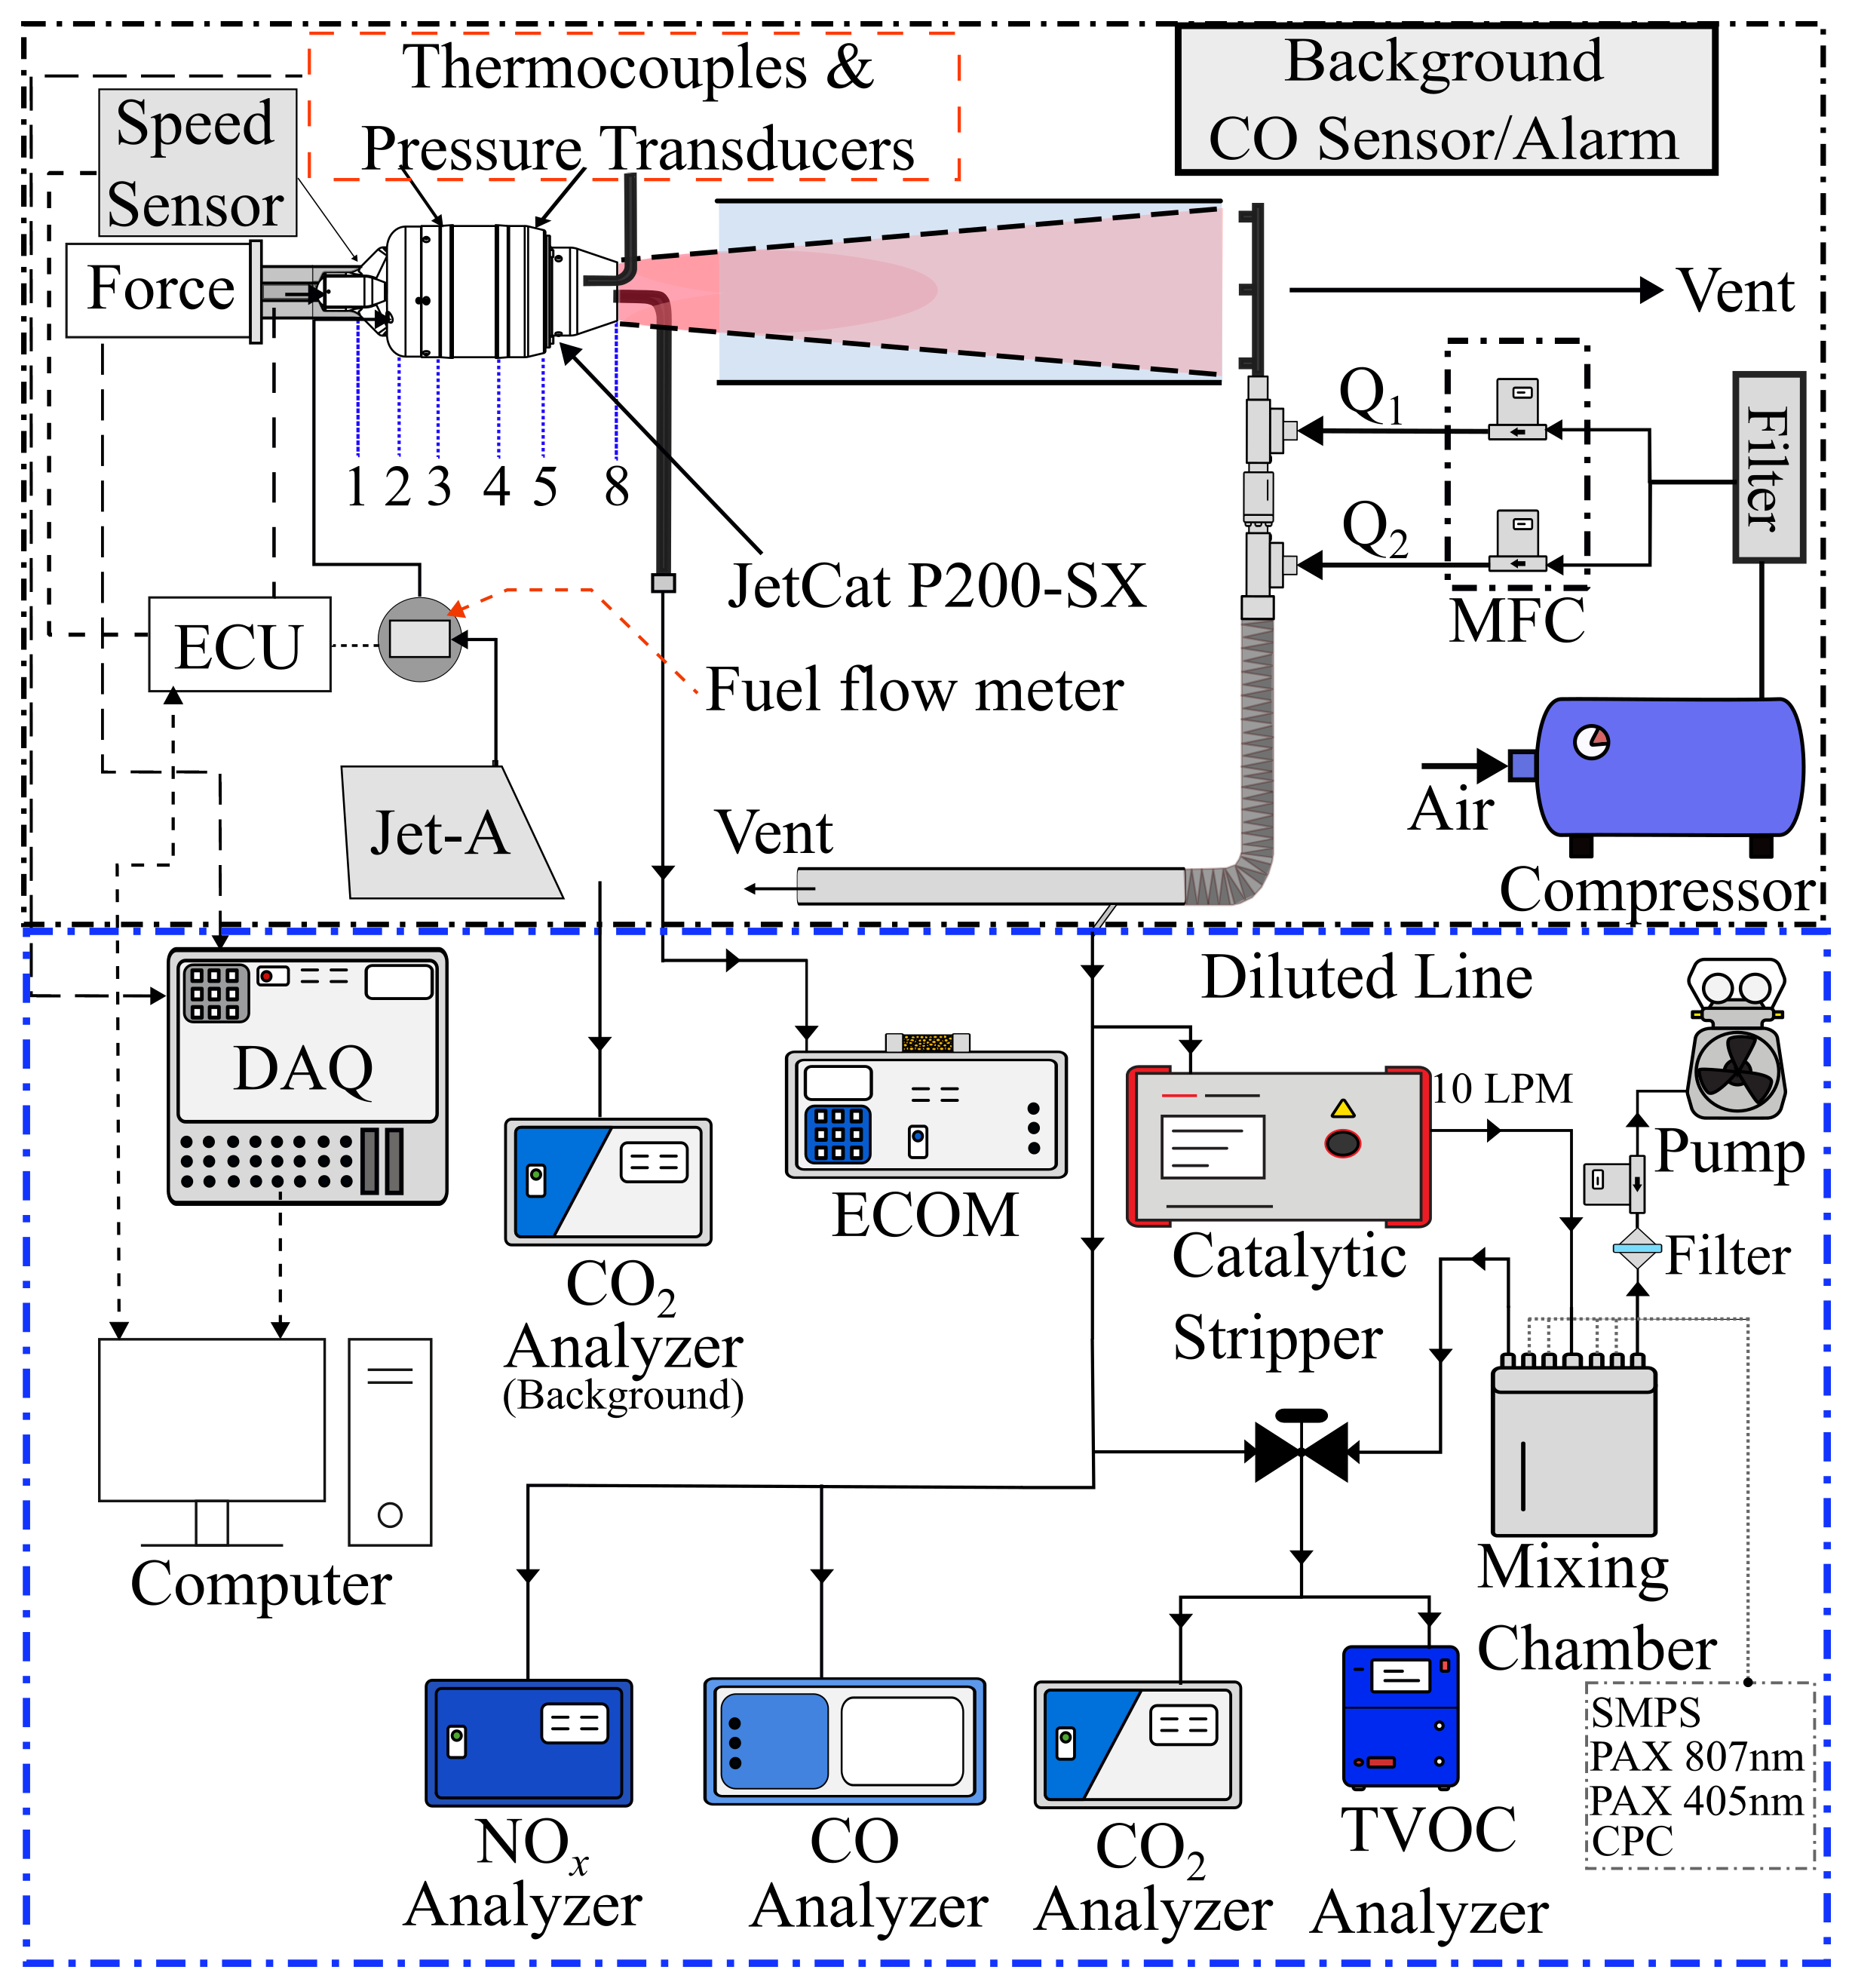
The performance channels are thrust (load cell), spool speed, fuel flow, and \(p_t, T_t\) at stations 3, 4 and 8. Two lines sample the exhaust [1, 4]:
- An undiluted line goes to an ECOM analyzer.
- A diluted line goes to the NOₓ (2B Tech 405 nm), CO (Teledyne T300U) and CO₂ (LI-COR LI-850) analyzers. It also goes through a catalytic stripper to a nano-SMPS for non-volatile particles.
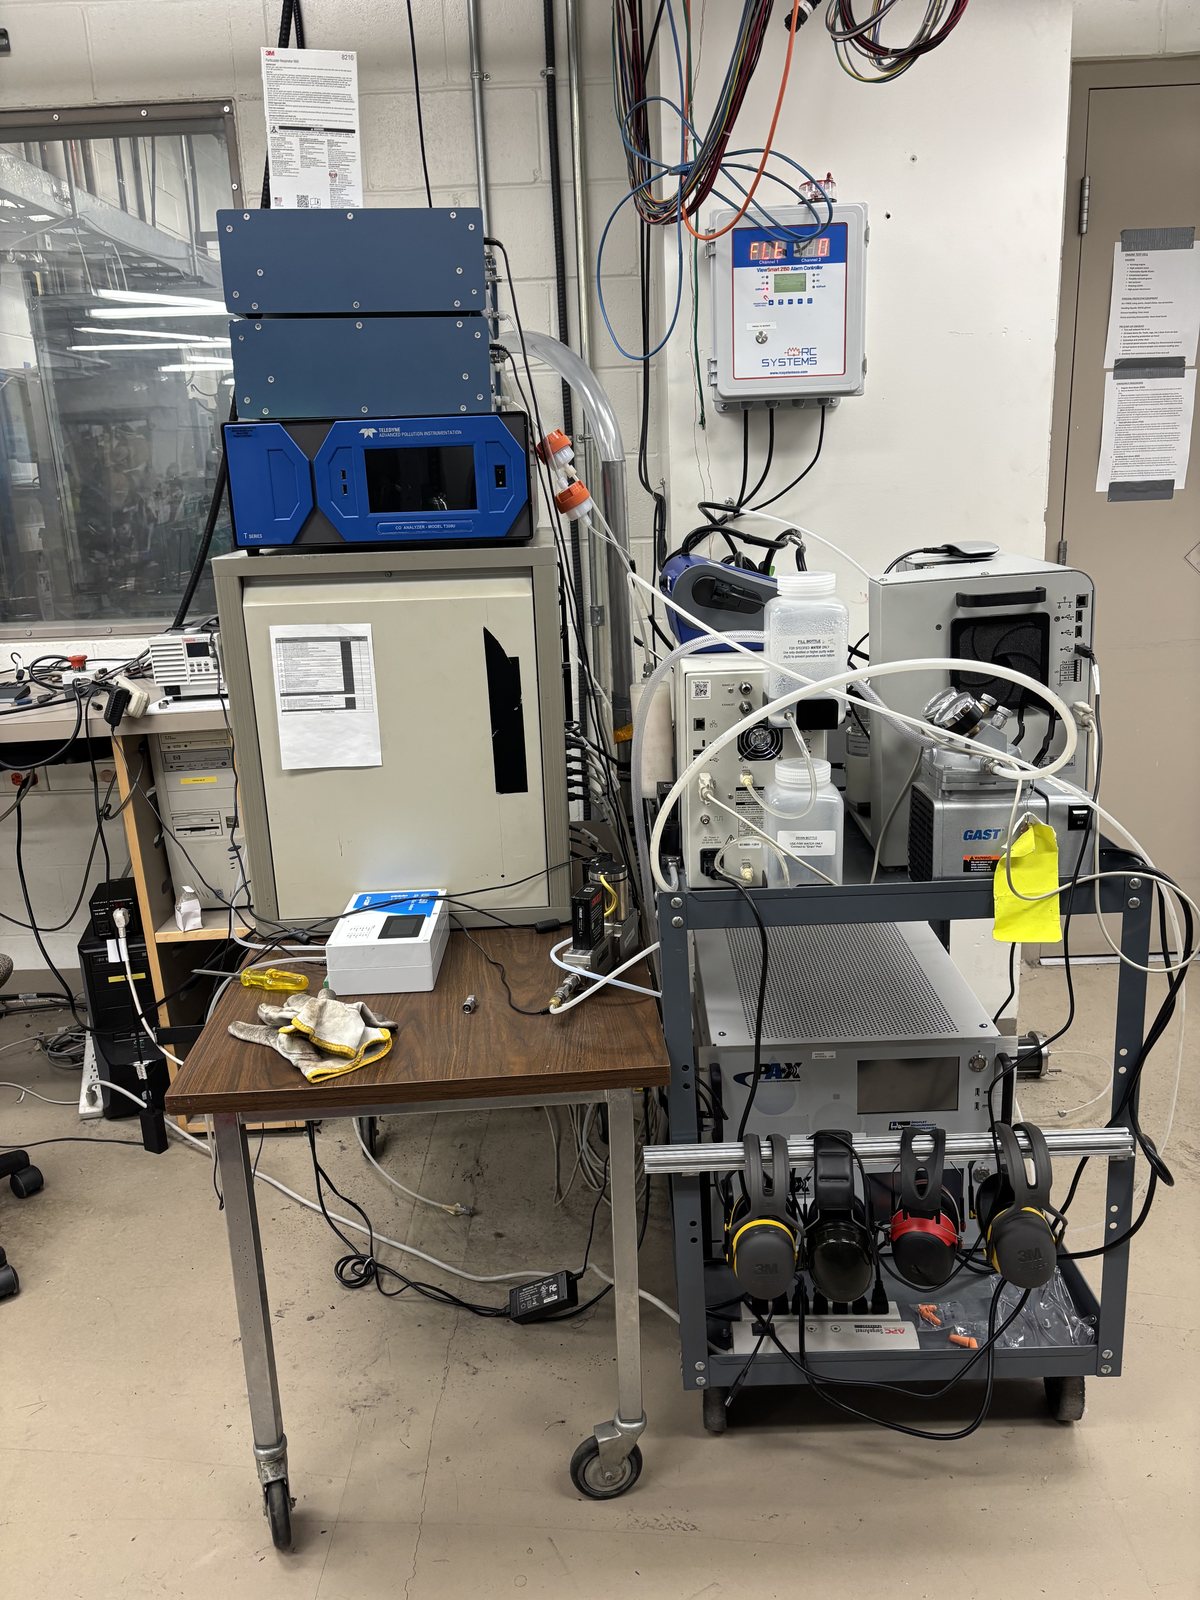
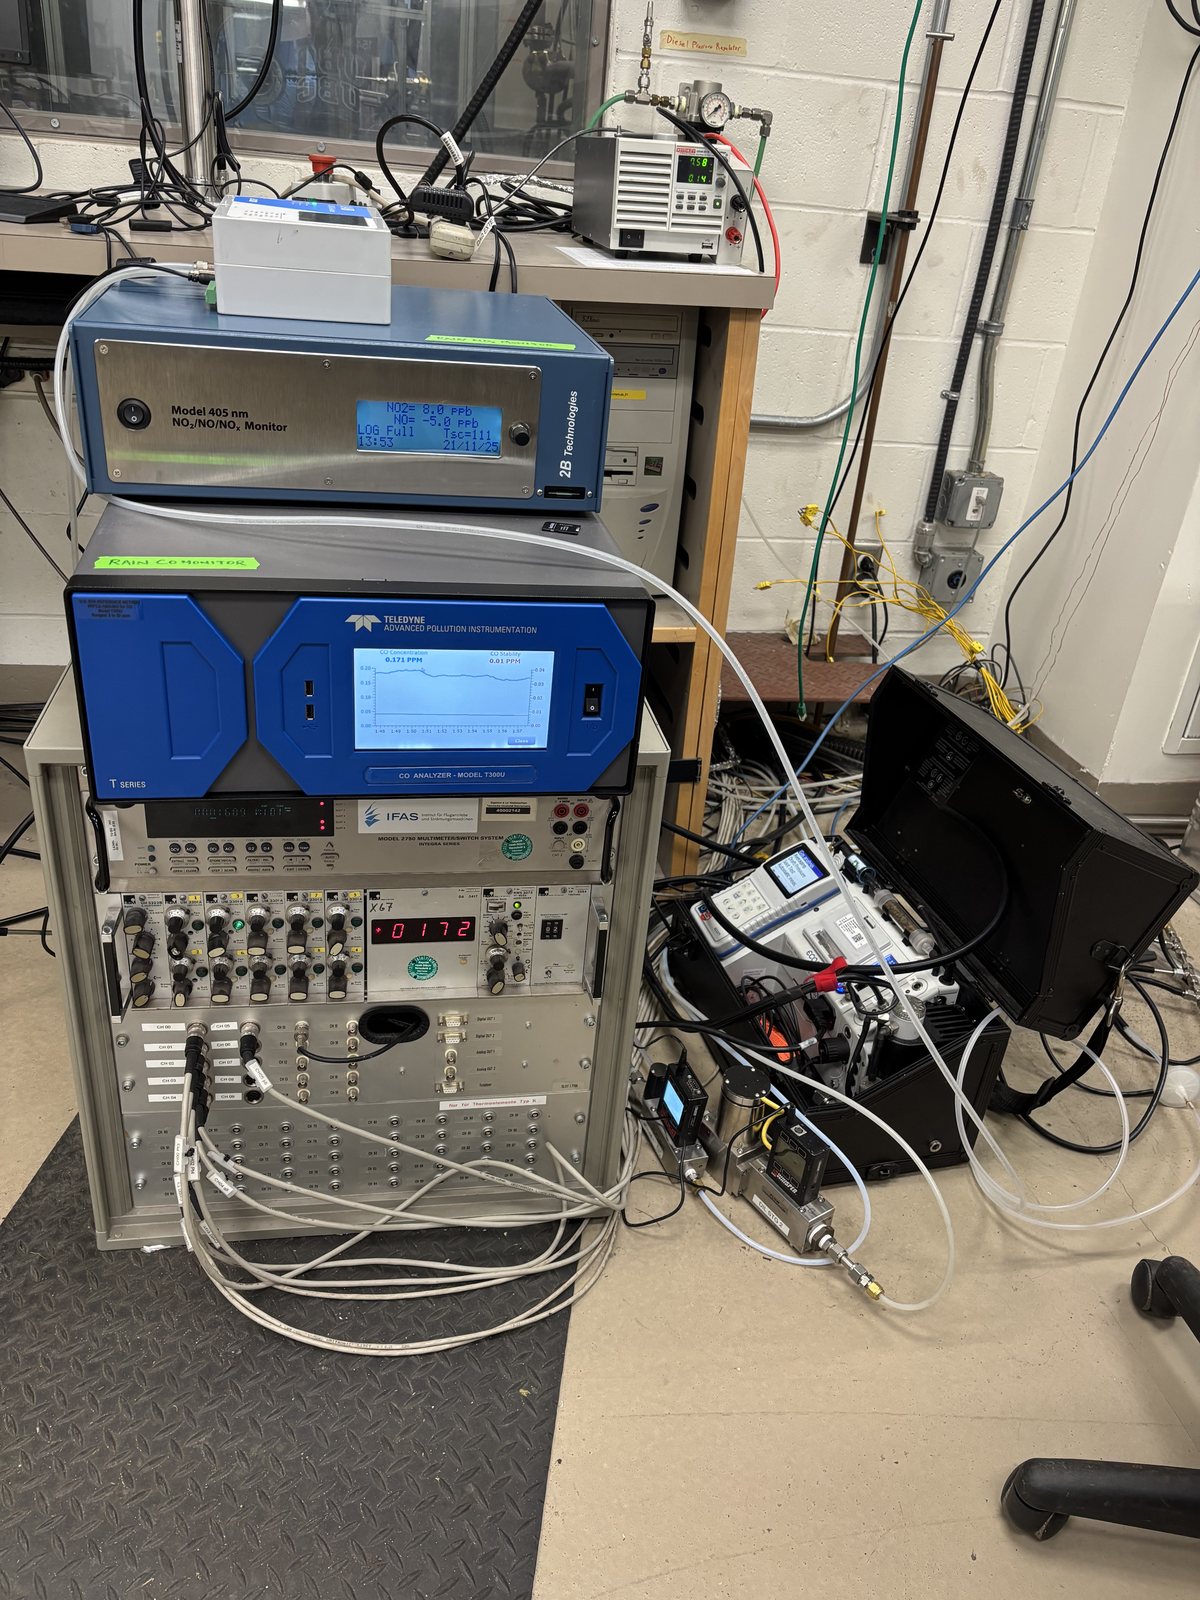
Emission indices come from a carbon balance on the diluted line. All species share the same denominator, the fuel carbon seen as CO₂ above background plus CO. In the numerator, only CO₂ has its background subtracted [4, 5]:
Molar mass \(M_i\), fuel carbon mass fraction \(Y_C\), combustion efficiency \(\eta_{\mathrm{comb}}\) (from the earlier CRN study), and diluted-line (DL) and background (bg) dry mole fractions. Background CO₂ was 450 ppm and background CO was 0 ppm in the GPPS campaign [5].
I propagate the uncertainty to first order from the analyzer accuracies and combine it in quadrature, following SAE ARP1533D [6].
| Analyzer | Species | Accuracy |
|---|---|---|
| 2B Tech Model 405 nm | NOₓ | ±2% |
| Teledyne API T300U | CO | ±1% |
| LI-COR LI-850 | CO₂ | ±1.5% |
The analyzers do not see some of the carbon: unburned hydrocarbons and lubricant volatiles from the engine’s open-loop oil system. An indirect check through the catalytic stripper puts this carbon below 6% of the total at the lowest operating point. It is lower at higher load. The check cannot separate fuel-derived from lubricant-derived carbon. Non-volatile particles carry less than 1% of the fuel carbon [1].
ResultsPerformance: the same thrust costs more liters, fewer kilograms
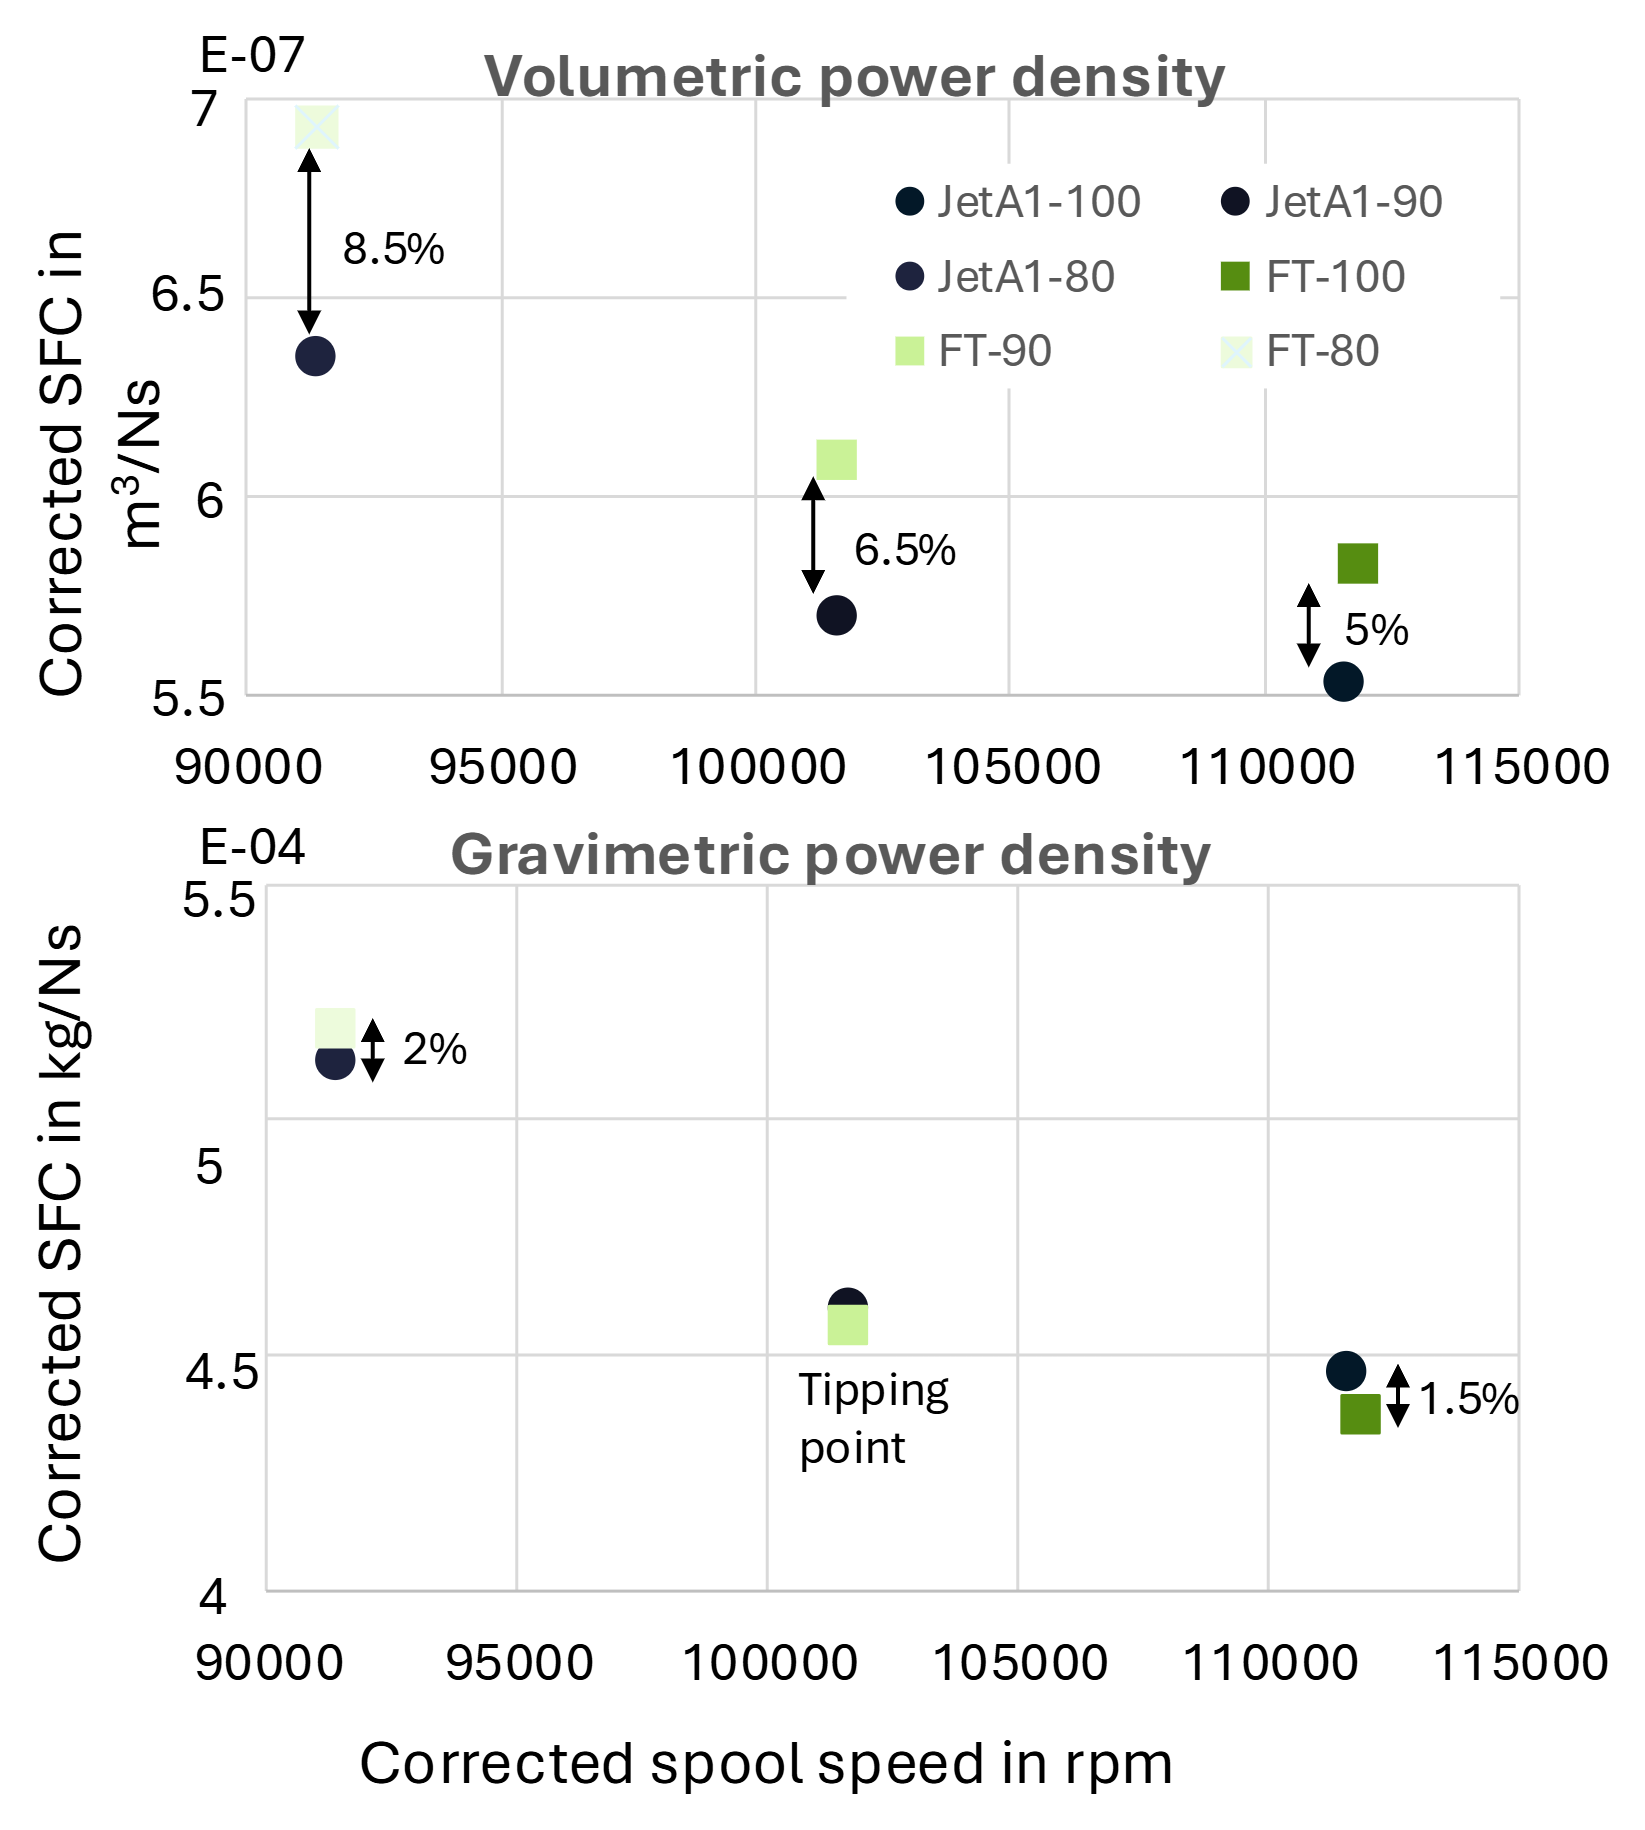
FT-SPK is less dense than Jet A-1, but it carries more energy per kilogram. In the March 2026 campaign, it needed 8.5%, 6.5% and 5.0% more fuel by volume at 80, 90 and 100% corrected speed. By mass, it needed about 2% more at 80% and about 1.5% less at 100%. The two fuels cross near 90%.
The fuel meter measures volume. The mass-based values therefore depend on the fuel densities used for the conversion.
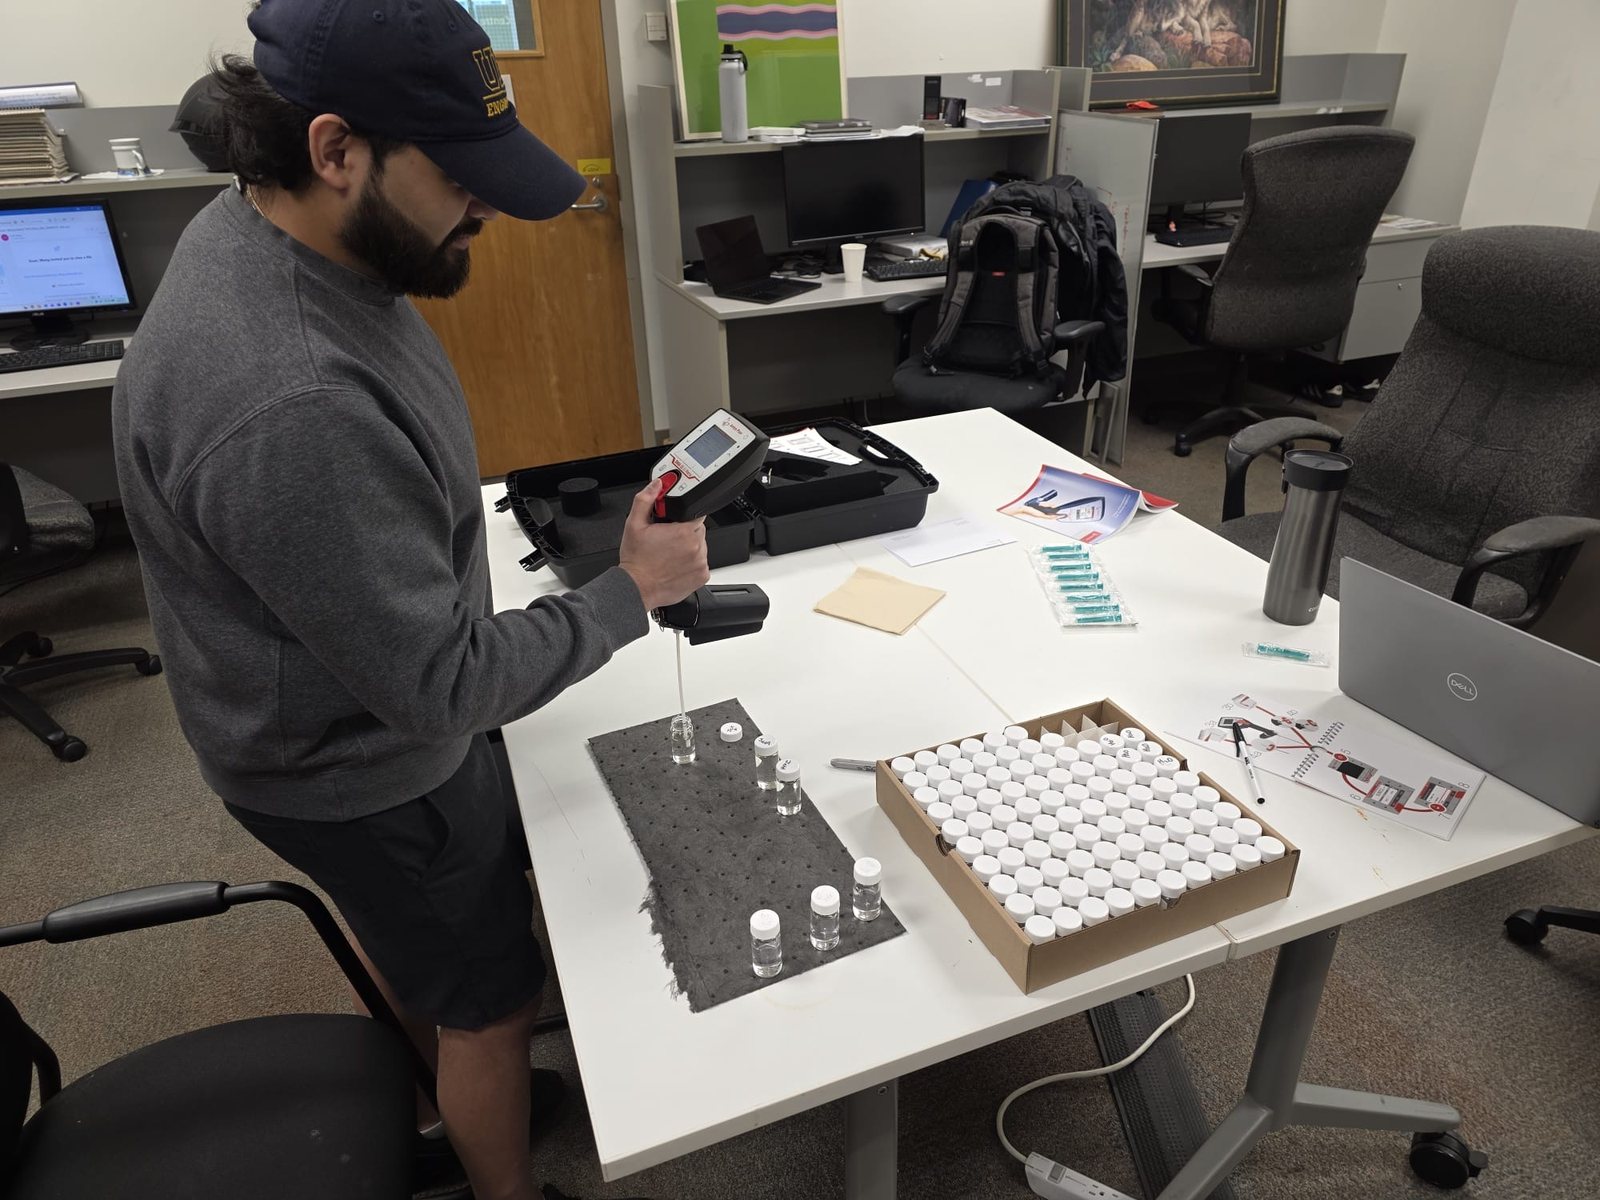
I measure the density and specific gravity of the Jet A and FT-SPK fuels with a portable density meter (Fig. 9). These values convert the metered volume into fuel mass.
The separate GPPS back-to-back test at maximum thrust shows the same direction, with different sizes. Volumetric TSFC rose by 4.3% and gravimetric TSFC fell by 5.3%. The measured combustor-outlet temperature \(T_{t4}\) dropped by 1.5% [5].
The two campaigns use different speed corrections and density inputs. I keep their numbers separate.
| Jet A-1 | FT-SPK | Change | |
|---|---|---|---|
| Thrust \(F_N\) | 205 N | 208 N | +1.5% |
| \(p_{t3}\) / \(T_{t3}\) | 369 kPa / 468 K | 370 kPa / 468 K | matched |
| Volume fuel flow (measured) | 1.21 × 10⁻⁵ m³/s | 1.28 × 10⁻⁵ m³/s | +6% |
| Fuel mass flow (from density) | 0.0101 kg/s | 0.0097 kg/s | −4% |
| \(T_{t4}\) (measured) | 1240 K | 1222 K | −1.5% |
| TSFC by volume / by mass | +4.3% / −5.3% |
ResultsEmissions: lower CO₂ and NOₓ, much lower soot mass
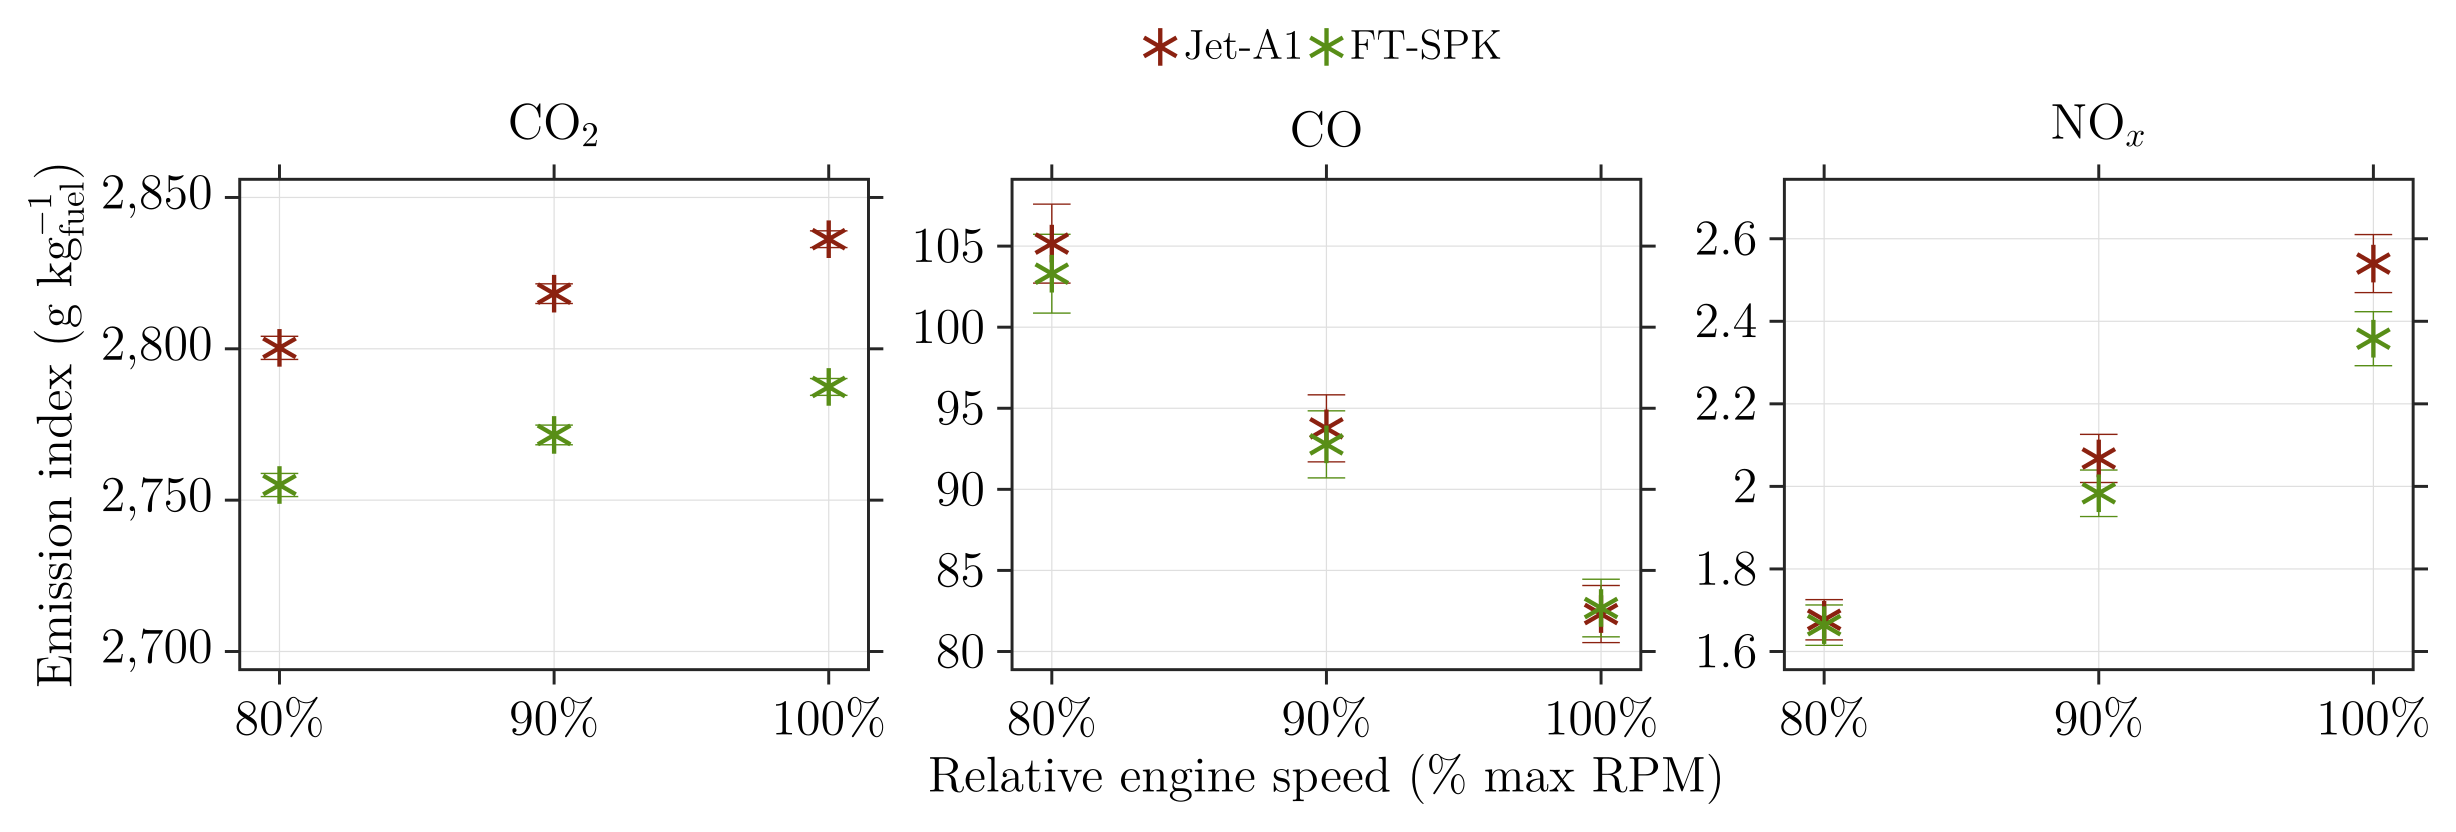
The Result view in the gallery above shows the emission indices of the March 2026 campaign at 80, 90 and 100% speed. CO falls and NOₓ rises with power, the same directions as the V2500 certification data [1].
In that campaign, FT-SPK has lower EI CO₂ at all three speeds. EI NOₓ is lower at 90 and 100%, and the same within uncertainty at 80%. The CO difference between the fuels is inside the error bars at every speed.
The GPPS test at maximum thrust gives EI CO₂ −1.7%, EI NOₓ −4% and EI CO +0.5% with FT-SPK [5]. Neither campaign shows a clear CO reduction.
The particle mass result is clearer than the number result. Soot mass fell by 72%, computed from sizes with a unit effective density [5]. Particle number rose by 38%, but that increase comes only from the smallest bins, where the loss correction is largest. Across almost the whole size range, the FT-SPK distribution was lower [5].
The CRN model predicts the FT-SPK change in \(T_{t4}\), EI CO₂ and EI NOₓ to within 1 percentage point of the measured change. For example, measured \(T_{t4}\) fell by 1.5% and the model gives 1.8%. The absolute values are still off: the model is about 3% high in \(T_{t4}\) and 70% high in NOₓ [5].
References
- [1]S. Sharma, D. Lieder, S. Saini, A. Kumar, P. Kirchen, J. Goeing and S. Rogak, “A micro-turbojet test rig to analyze the impact of jet fuels on emissions and performance,” Proc. CSME International Congress / 33rd Annual Conf. CFD Society of Canada, Vancouver, May 2026, Paper 361.
- [2]J. Göing, Modellierung des nicht-linearen aerothermodynamischen Systemverhaltens von Flugantrieben, PhD thesis, Technische Universität Braunschweig, 2023. (Source of the V2500 operating data.)
- [3]D. Lieder, S. Sharma, P. Kirchen, S. Rogak and J. Goeing, “Development of a validated chemical reactor network model for non-CO₂ emissions in RQL aircraft combustors,” ASME Journal of Engineering for Gas Turbines and Power, accepted (GTP-26-1516); Proc. ASME Turbo Expo 2026, GT2026-177253.
- [4]S. Sharma, D. Lieder, N. Sapkota, H. Lintusaari, A. Kumar, P. Kirchen, J. Goeing and S. Rogak, “Experimental and model characterization of jet fuel emissions in a micro-turbojet engine,” Combustion Institute – Canadian Section Spring Technical Meeting, Concordia University, May 2026.
- [5]D. Lieder, S. Sharma, H. Lintusaari, N. Sapkota, A. Kumar, P. Kirchen, J. Friedrichs, S. Rogak and J. Goeing, “Measurement and prediction of particle emissions from a micro turbojet using conventional and alternative jet fuel,” Proc. GPPS Montreal26, GPPS-TC-2026-102, 2026, doi:10.33737/gpps26-tc-102.
- [6]SAE International, ARP1533D: Procedure for the Analysis and Evaluation of Gaseous Emissions from Aircraft Engines.