Home / Research

Areas of work

What I measure in the test cell, and why it matters for aviation emissions.

Why it matters

Why a micro-turbojet
Pollutant formation, and the climate impact that follows, is highly sensitive to fuel chemistry and operating point. Studying those sensitivities needs a controlled platform and a tractable, physics-informed approach.

The challenge
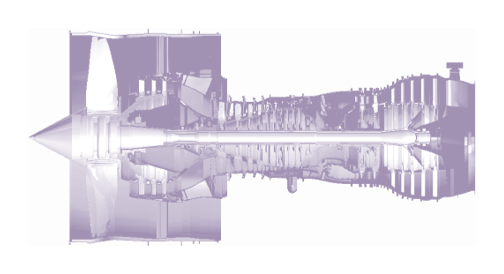
Full-scale turbofan cutaway

Characterizing SAFs on a full-scale turbofan is:

  • Highly regulated
  • Fuel-hungry: tens of thousands of litres per campaign
  • Very expensive
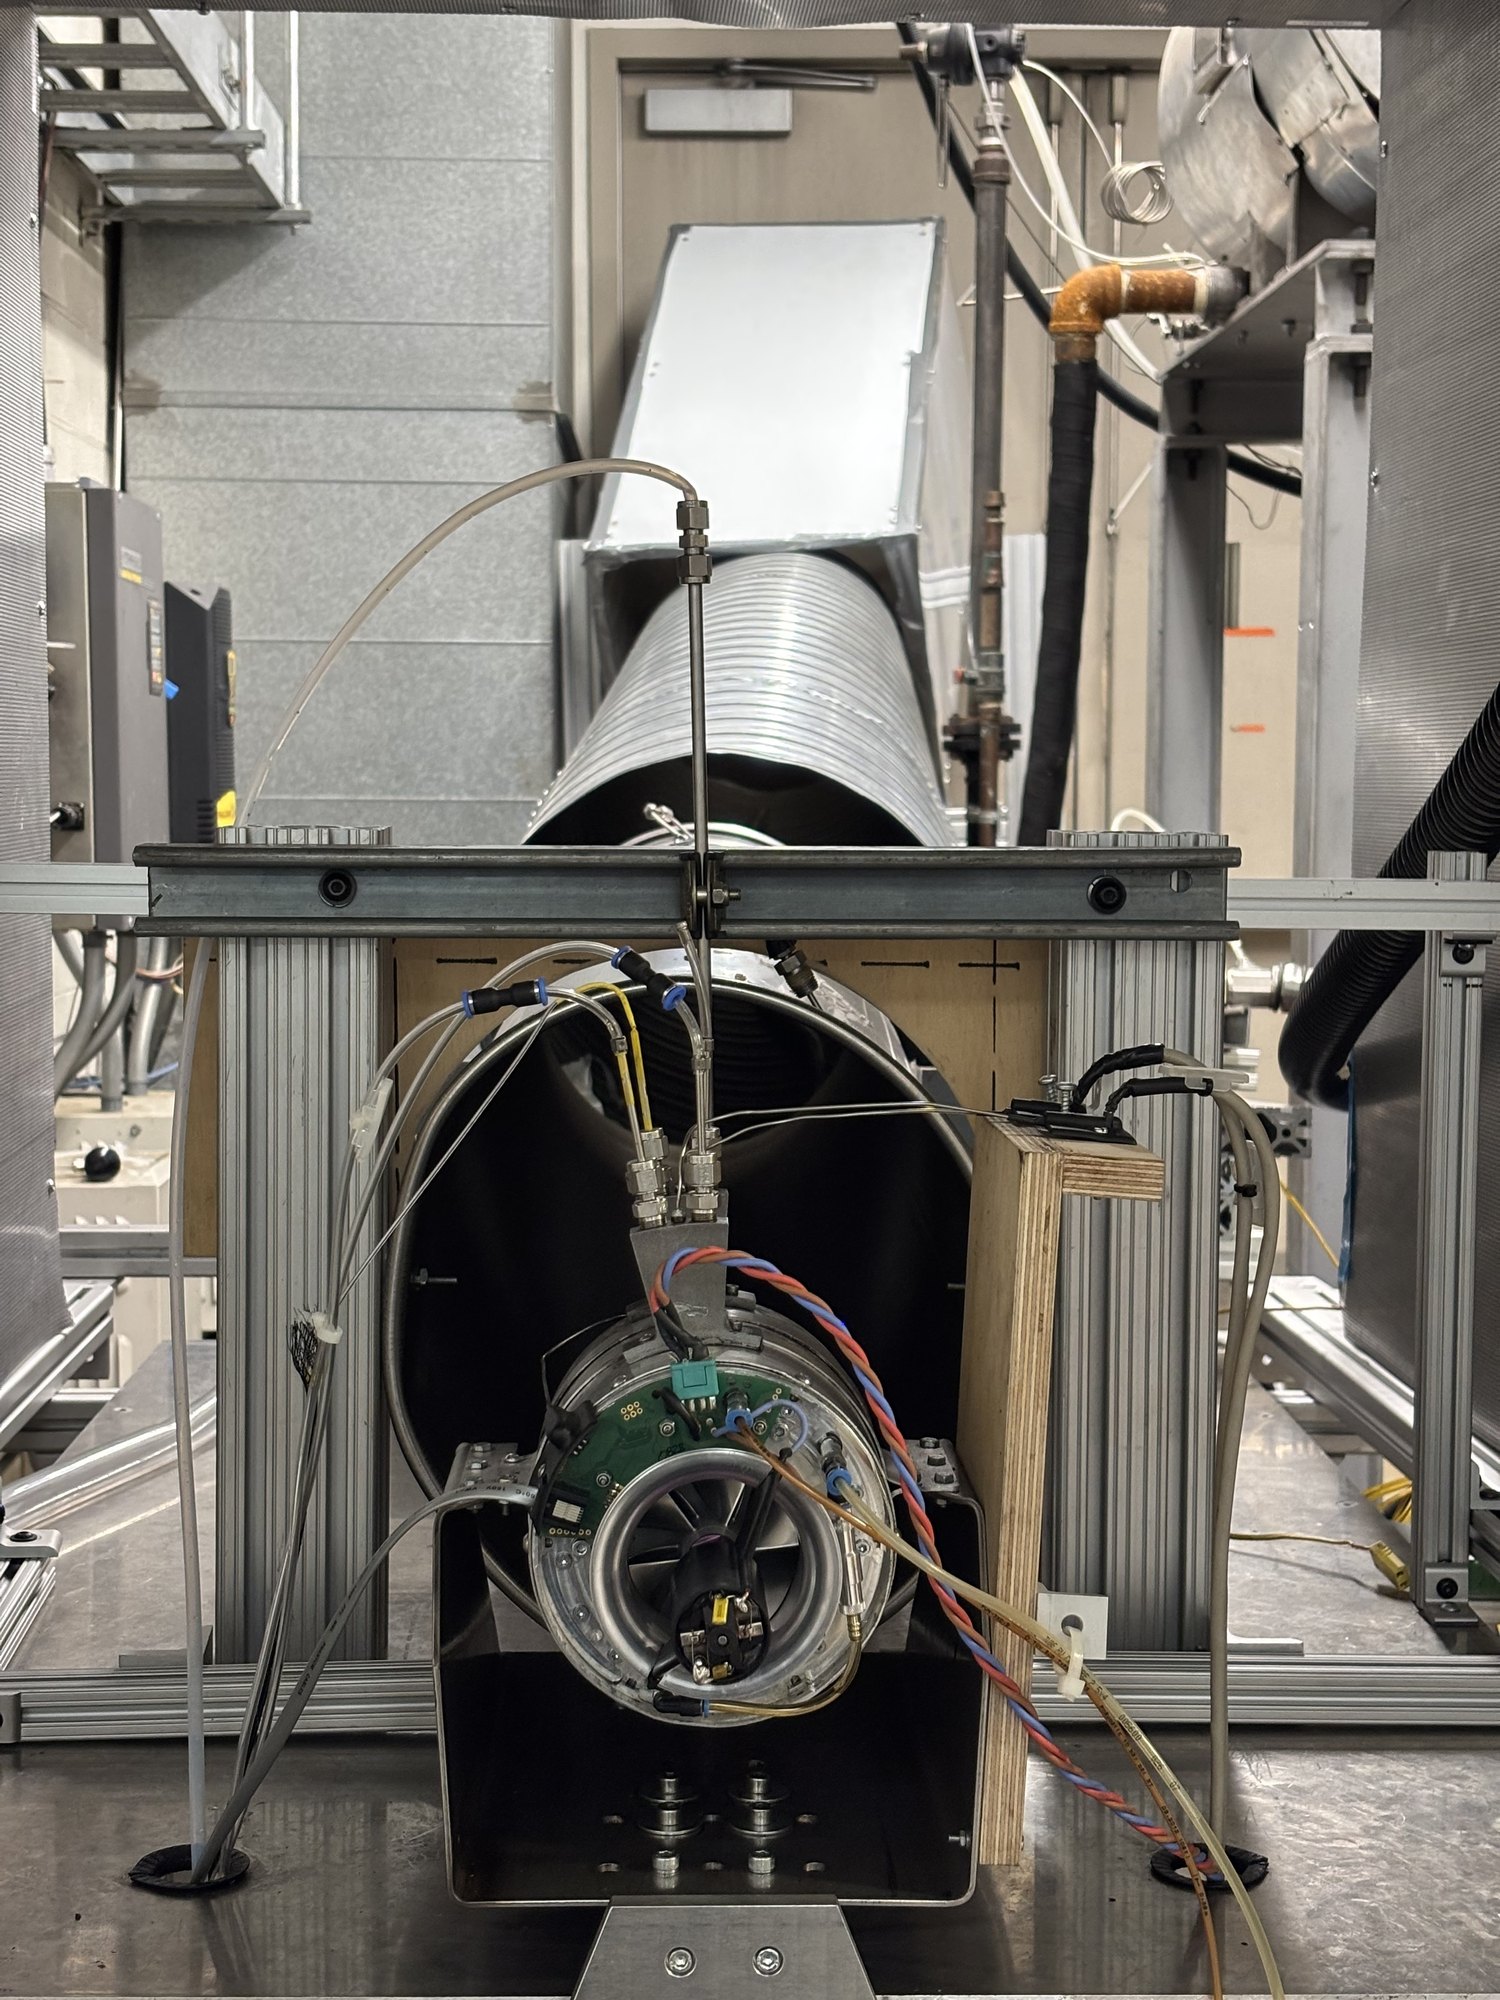
Micro-turbojet (MTJ) test rig
JetCat P200-SX on the instrumented stand

A cost-effective, controlled platform:

  • Repeatable, back-to-back experiments
  • Modest fuel use across the whole operating envelope
  • At maximum thrust, combustor-inlet temperature and pressure are close to a turbofan at idle

Aviation contributes an estimated 3–5% of global anthropogenic climate forcing. More than half of that impact comes from non-CO₂ effects: NOₓ chemistry, soot acting as ice-nucleating particles, and contrail cirrus. CO₂ alone is an incomplete proxy for aviation’s total impact [1].

Pollutant formation depends on fuel chemistry and on the engine operating point, yet experiments on full-scale turbofans are expensive, logistically complex and tightly regulated. My work uses a controlled micro-turbojet to measure those sensitivities at tractable cost. A reactor-network model from our collaborators helps explain them [1].

  1. [1]S. Sharma, D. Lieder, S. Saini, A. Kumar, P. Kirchen, J. Goeing and S. Rogak, “A micro-turbojet test rig to analyze the impact of jet fuels on emissions and performance,” Proc. CSME International Congress / 33rd Annual Conf. CFD Society of Canada, Vancouver, BC, May 2026, Paper 361. Publications →
Engine similarity

The rig is useful at one selected comparison point. At maximum thrust, the P200-SX reaches a combustor-inlet temperature and pressure within about 16 K and 24 kPa of an IAE V2500 turbofan at idle. We call this the “micro-max / macro-idle” comparison.

The small engine therefore burns fuel at a combustor-inlet state that a full-scale engine sees at idle, with about a tenth of the fuel flow. Residence time, size, heat loss and the lubricant input still differ, so this is not full engine similarity. The comparison is worked through on the JET-CALF project page.
The facility

Where the measurements come from

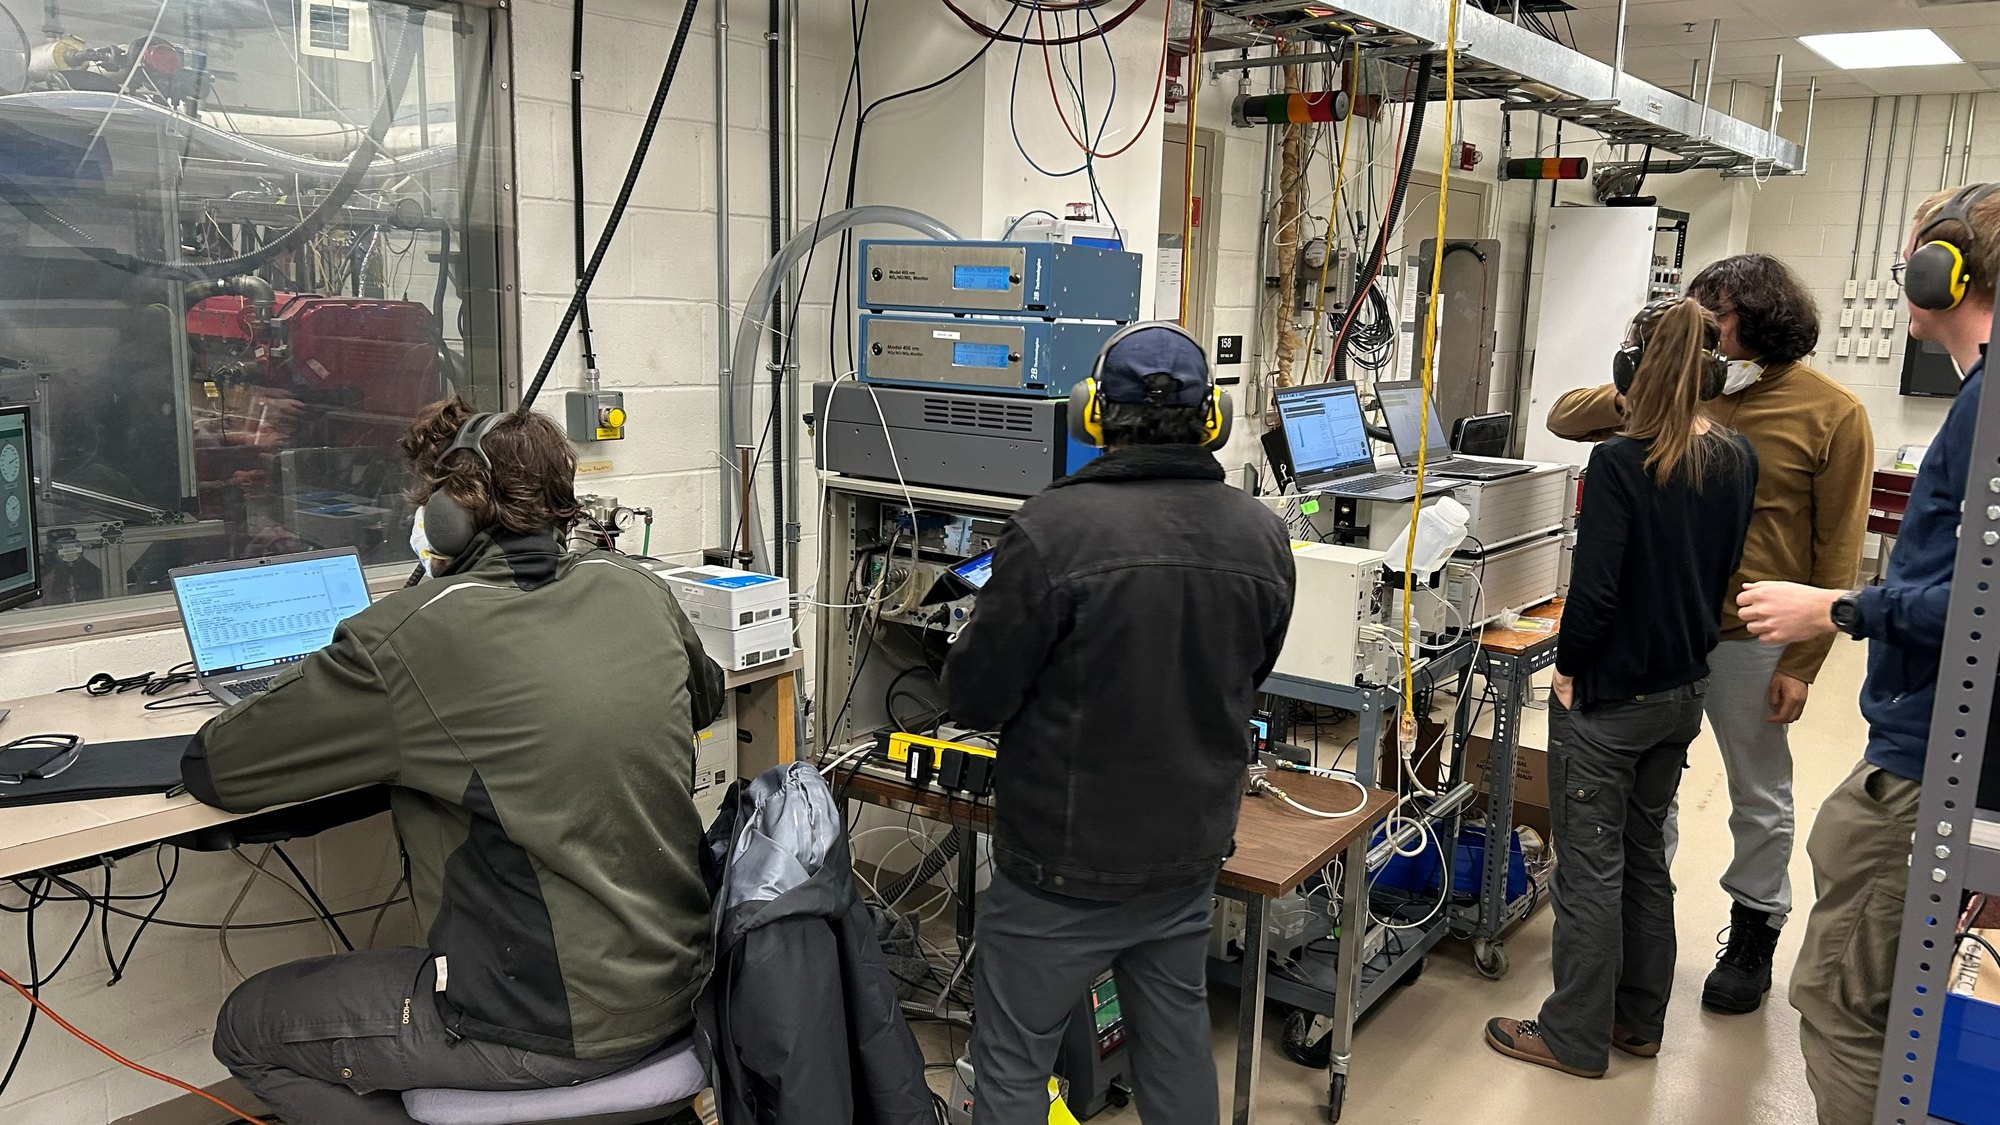
Running a back-to-back fuel campaign from the control bench, UBC test cell
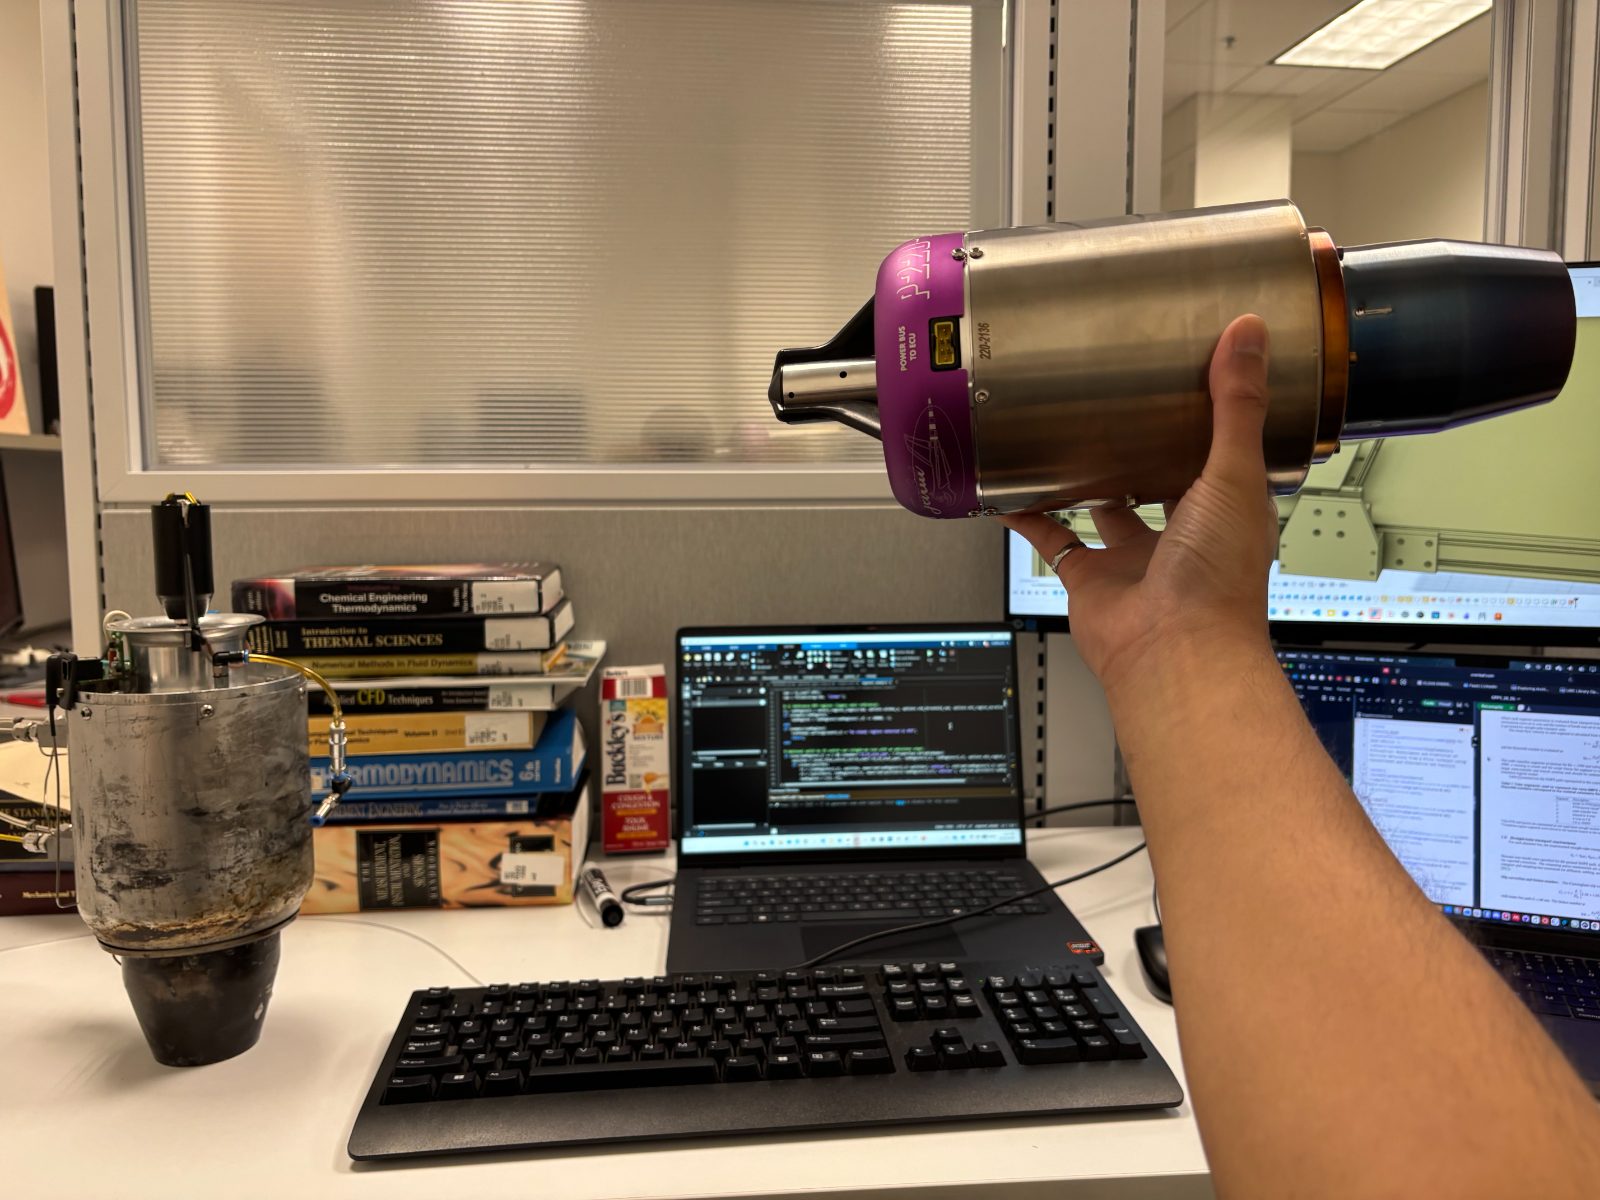
Old P200-SX engine on the desk, and the new JetCat P220-RXi in my hand. I am instrumenting the new engine now!
Methods

Engine, instrumentation & model

Figures from the CICS 2026 talk and the April 2026 JET-CALF update. Click any figure to enlarge.

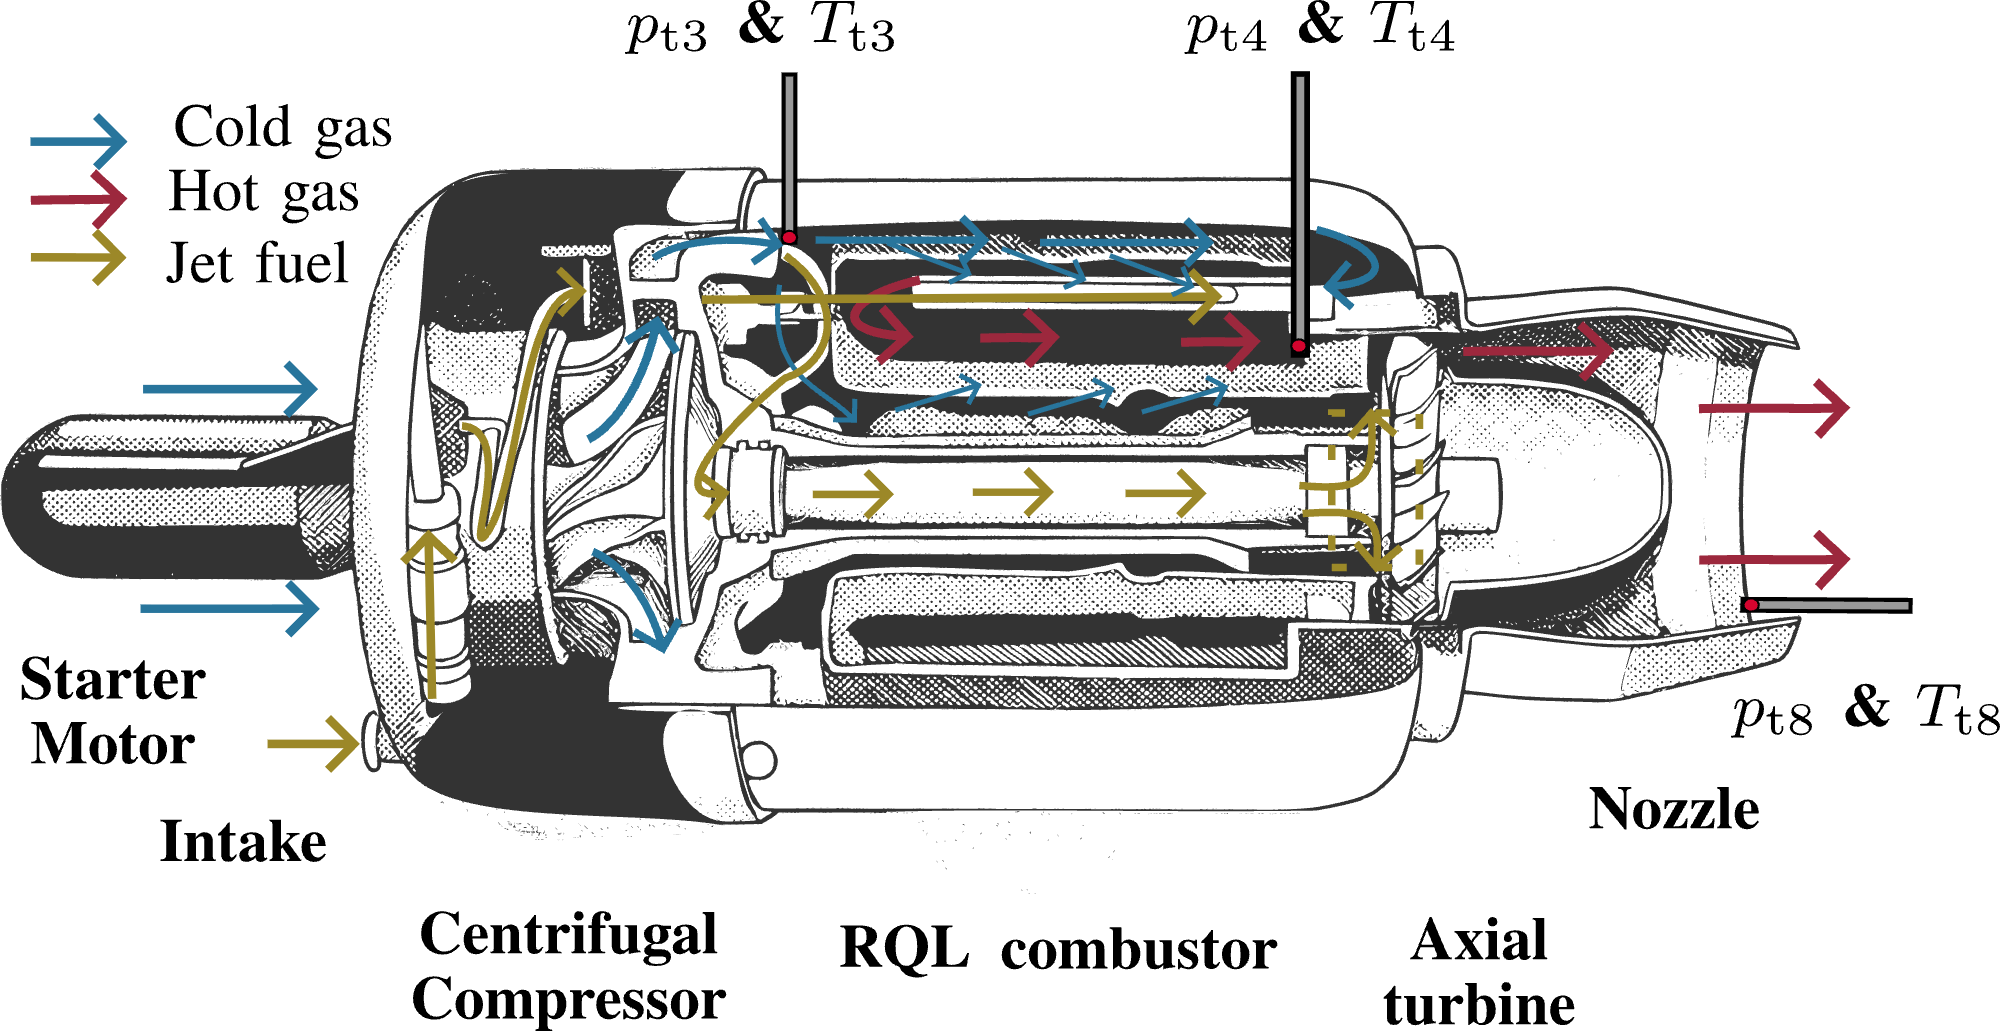
JetCat P200-SX cross-section
JetCat P200-SX cross-section. Centrifugal compressor, reverse-flow RQL combustor, and axial turbine, with station labels for \(p_{t3}\), \(T_{t3}\), \(p_{t4}\), and \(T_{t4}\).
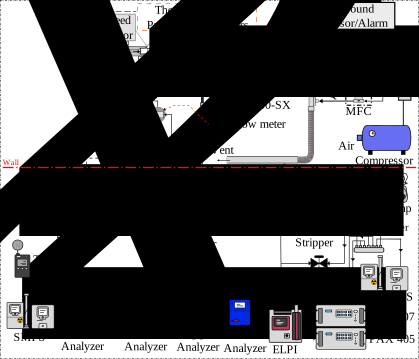
Experimental setup
Experimental setup. Engine, fuel metering and DAQ. An undiluted jet-core line goes to the ECOM analyzer. An ejector-diluted line feeds the gas analyzers, and a catalytic stripper ahead of the particle instruments.
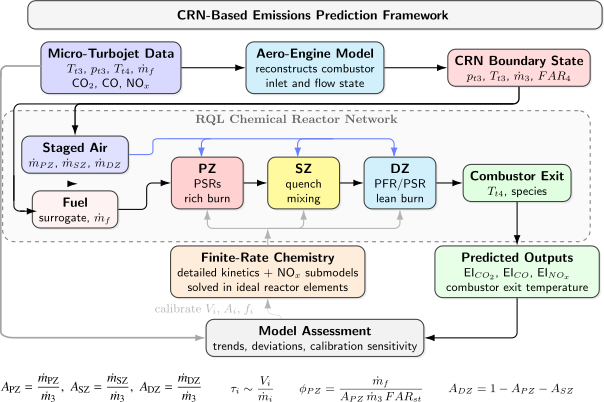
CRN-based emissions prediction framework
CRN-based emissions prediction framework. The aero-engine model sets the combustor-inlet and boundary states. A staged reactor network (primary, secondary, dilution zones) with finite-rate chemistry predicts EI and nvPM.
Results

What the measurements show

Each result is worked through, with its figures and uncertainties, on its project page.

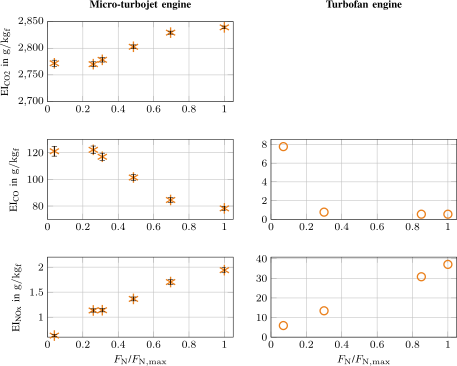
Micro-turbojet vs V2500 turbofan (Jet A-1)
Micro-turbojet vs V2500 turbofan (Jet A-1). With rising thrust, CO falls and NOₓ rises in both the micro-turbojet data and the V2500 certification data. The absolute values differ. The certification data give no EI CO₂.

Qualitative trends, not absolute values

This figure compares trends. At the selected point, the combustor-inlet temperature and pressure of the two engines are close. Reaction rates depend on these intensive conditions:

\[k=A\,p^{n}\exp\!\left(-\frac{E_a}{RT}\right)\]

Arrhenius rate with a pressure dependence. CO, NOₓ, unburned hydrocarbons and soot precursors do not reach equilibrium in a gas turbine, so finite-rate chemistry sets them. That is also why our model is a reactor network with finite-rate chemistry.

The absolute values still differ, because the combustors differ:

  • Residence time. Approximately 2 ms in the micro-turbojet and more than 6 ms in a large engine. These are approximate values from the combined performance model (ASTOR) and CRN model of our TU Braunschweig collaborators. A large engine has more time to oxidize CO.
  • Flame temperature. The small combustor has a high surface-to-volume ratio and loses heat to its walls. Its peak flame temperature is lower, so it makes much less thermal (Zeldovich) NOₓ, which grows strongly with temperature.
  • Efficiency and pressure ratio. A large engine is far more efficient, with a maximum pressure ratio above 30, against about 4.

I compare the direction of the trends. CO falls and NOₓ rises with thrust in both engines, and these shared trends are what the comparison is for.

Research Focus

The six areas in detail

01

Micro-Turbojet Experimental Testing

Controlled, repeatable testing of a JetCat P200-SX as a research platform. We run back-to-back fuel tests at selected operating points, with thermodynamic and emissions measurements under laboratory conditions.

JetCat P200-SXback-to-back testsDAQtest-cell commissioning
02

Sustainable Aviation Fuels & Emissions

Characterizing how conventional Jet A-1 and Fischer–Tropsch fuel (FT-SPK) change gaseous and particulate emissions. In the March 2026 back-to-back tests, FT-SPK gave lower EI CO₂ at all three speeds and lower EI NOₓ at 90 and 100% speed. The CO difference was within the measurement uncertainty. The separate GPPS test at maximum thrust measured a 0.5% CO increase.

Jet A-1FT-SPKemission indices
03

Combustion & Chemical Reactor Network Modeling

A physics-based chemical reactor network (CRN), built at TU Braunschweig, solves finite-rate chemistry in idealized reactors that represent the zones of a rich-quench-lean (RQL) combustor. My micro-turbojet measurements calibrate and test it.

CRNRQL combustorfinite-rate chemistrysurrogate fuels
04

Thermodynamic Scaling & Engine Similarity

The “micro-max / macro-idle” comparison: at maximum thrust, the micro-turbojet’s combustor-inlet conditions (OPR, \(T_{t3}\), \(p_{t3}\)) are close to those of an IAE V2500 at idle. It is one selected comparison point for the combustor inlet.

engine similaritycombustor inlet matchingV2500 reference
05

Aerosols, Soot & nvPM Characterization

Measuring non-volatile particle size distributions behind a catalytic stripper, with size-dependent corrections for sampling-line and stripper losses. In the loss-corrected data, FT-SPK shifts the soot size distribution to smaller particles. The number maximum moves from about 4 nm to about 3 nm.

nvPMSMPScatalytic strippersize distributions
06

Future Interests

Fuel–turbulence–chemistry coupling in aircraft combustors, combustor-exit flow and turbine aerothermodynamics, and multiscale validation of sustainable propulsion. See my research interests. I also care about how contrails form, and about drop-in alternative aviation fuels.

combustor–turbine couplingRANS / LESturbulent combustioncontrail formationdrop-in fuels
See the projects behind this →
The bigger picture

Why drop-in fuels, and why they are hard to test

The fleet we have

Airliners and their engines stay in service for decades. Most jet fuel burned over the next few decades will therefore burn in engines that already exist. Most of the rest will burn in engines designed for conventional jet fuel. Any near-term cut in emissions has to work in those engines.

CO₂ is only part of the problem

Aviation warms the climate through CO₂ and through non-CO₂ effects: contrail cirrus, NOₓ chemistry, and soot and sulfur aerosols. Lee et al. estimate that non-CO₂ effects are about two-thirds of aviation’s net effective radiative forcing, with contrail cirrus the largest single term [2]. The uncertainty in the non-CO₂ terms is large, but they are too big to ignore.

Why drop-in fuels

A drop-in fuel works in existing engines, aircraft and fuel systems without changes. Synthetic paraffinic kerosenes, such as Fischer–Tropsch fuel (FT-SPK), are one example. They can cut life-cycle CO₂ when they come from low-carbon feedstocks, and they contain almost no aromatics, which are the main source of soot.

The catch: testing and certification

A new fuel must show that it behaves like conventional jet fuel. ASTM D7566 sets the specification for synthetic blend components, and for most production pathways it limits the blend to 50% with conventional fuel [3]. ASTM D4054 sets the qualification process: fuel property tests, fit-for-purpose tests, then rig and engine tests [4]. The engine tests need large volumes of a fuel that is still scarce and expensive. That is a real bottleneck, and it is the gap a small, cheap, controlled engine can help fill.

How a different chemistry changes the engine

A drop-in fuel meets the same specification, but it is not the same molecule mix. The differences matter:

  • Fewer aromatics, less soot. Aromatics feed the polycyclic aromatic hydrocarbons that grow into soot. Less aromatic content usually means less soot mass.
  • Aromatics also swell seals. Elastomer seals in older fuel systems depend on aromatic swelling. This is one reason D7566 requires at least 8% aromatics in the final blend [3].
  • Lower density, higher energy per kilogram. The engine usually needs fewer kilograms but more liters for the same thrust. In our March 2026 campaign, this held at 100% speed but not at 80%.
  • Different volatility and viscosity. These change atomization, evaporation and mixing. The effect is largest at low power, where CO and unburned hydrocarbons form, and near ignition and lean blow-out limits.
  • NOₓ follows flame temperature. It changes much less with fuel than soot does.

What our engine shows

On our micro-turbojet in the March 2026 campaign, FT-SPK used 5.0% more fuel by volume at 100% speed (8.5% more at 80%). By mass, it used about 1.5% less at 100% speed [6].

In the separate GPPS test at maximum thrust, FT-SPK lowered EI CO₂ by 1.7% and EI NOₓ by 4%. EI CO rose by 0.5%. Soot mass, computed with a unit effective density, fell by 72% [5].

The measured soot particle number rose by 38%. That increase comes only from the smallest, most strongly loss-corrected size bins. Across almost the whole size range, the FT-SPK distribution was lower [5].

Particle number matters for contrails. For RQL engines, contrail ice crystal number has been shown to correlate with the number of emitted nvPM particles [5]. A cut in soot mass does not by itself show a cut in ice nuclei. Our number result is the least certain part of the data, which is why this fuel effect needs careful, repeated measurement.

  1. [2]D. S. Lee et al., “The contribution of global aviation to anthropogenic climate forcing for 2000 to 2018,” Atmospheric Environment 244, 117834, 2021.
  2. [3]ASTM D7566, Standard Specification for Aviation Turbine Fuel Containing Synthesized Hydrocarbons, ASTM International.
  3. [4]ASTM D4054, Standard Practice for Evaluation of New Aviation Turbine Fuels and Fuel Additives, ASTM International.
  4. [5]D. Lieder, S. Sharma et al., “Measurement and prediction of particle emissions from a micro turbojet using conventional and alternative jet fuel,” Proc. GPPS Montreal26, GPPS-TC-2026-102, 2026. Maximum-thrust gas and particle results from the GPPS campaign.
  5. [6]S. Sharma, “JET-CALF preliminary work: performance and gaseous emission measurement,” JET-CALF project update, April 2026. Volume and mass fuel-use figures from the March 2026 campaign. Slides