CRN Validation & Full-Scale Extrapolation
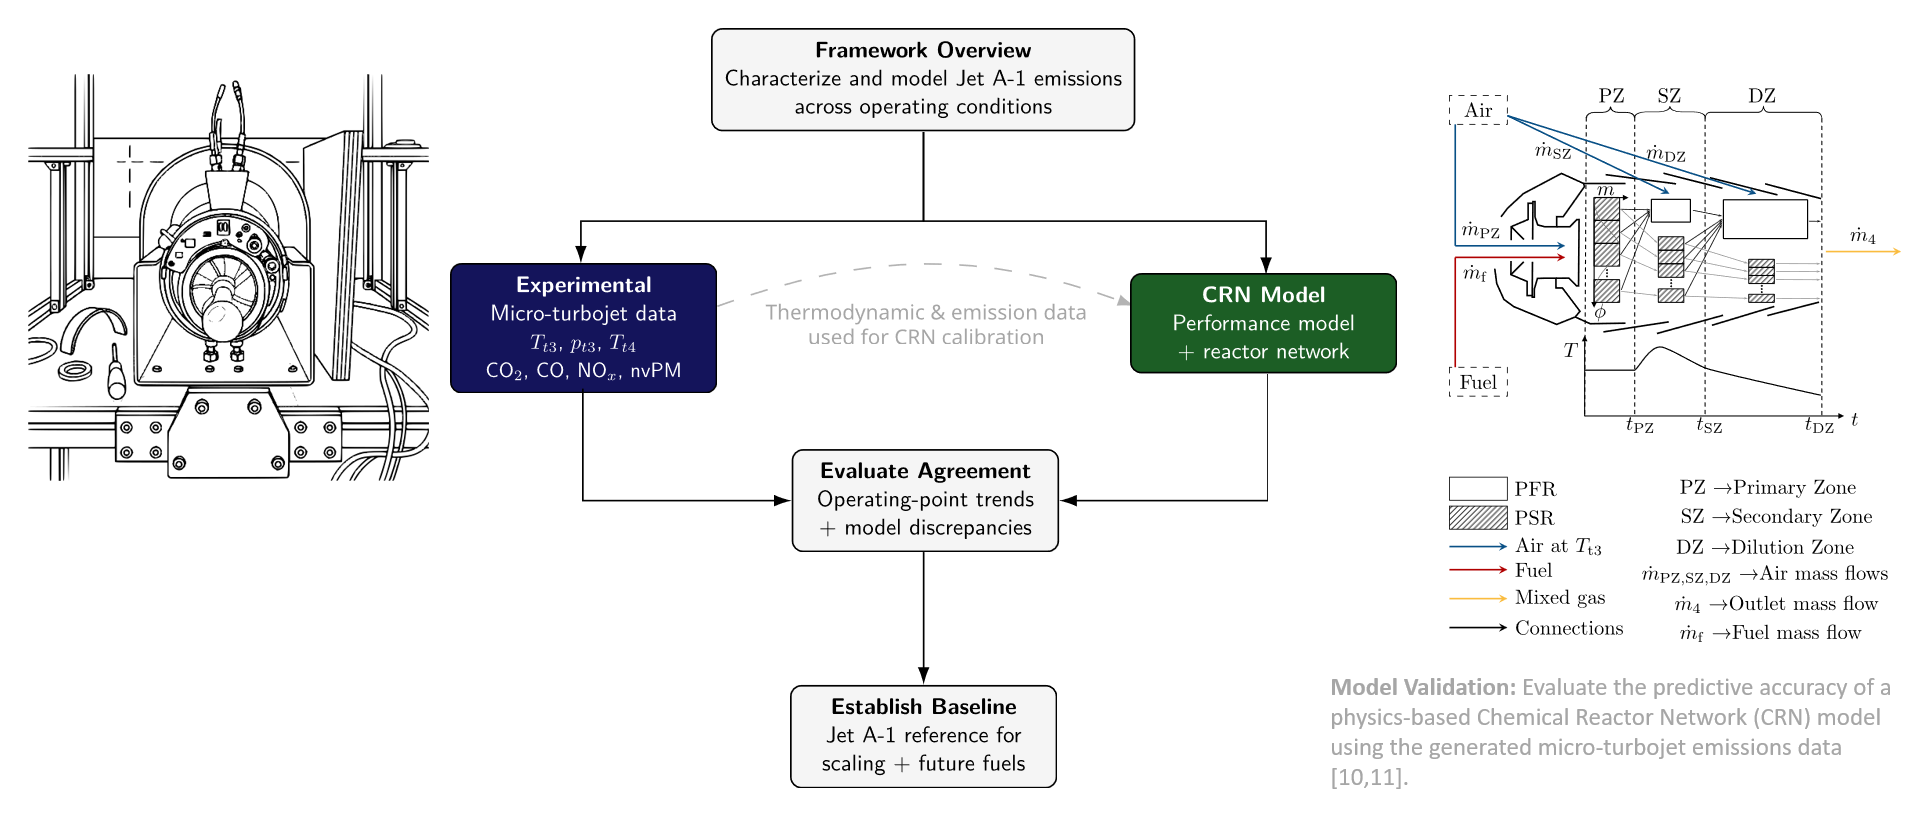
Graduate researchDaniel Lieder (TU Braunschweig) built a chemical reactor network (CRN) for the RQL combustor of the P200-SX. My measurements calibrate and test it. Against the Jet A-1 data of the ASME paper, it reproduces outlet temperature, EI CO₂ and EI CO within 4.5%. It overpredicts NOₓ by about 1.8×. In the GPPS fuel comparison, it predicts the measured fuel-induced changes in \(T_{t4}\), CO₂ and NOₓ within 1 percentage point. It does not predict the particle-number change.
WhatWhy a reactor network
Aircraft emission estimates usually come from semi-empirical correlations, such as the Boeing Fuel Flow Method 2 (BFFM2), fitted to certification data. They are quick, but they are calibrated for conventional jet fuel. They also capture operating-point effects only through correlation [1]. A chemical reactor network (CRN) models the physics instead. Each combustor zone becomes an idealized reactor with finite-rate chemistry, so fuel composition and operating point enter directly.
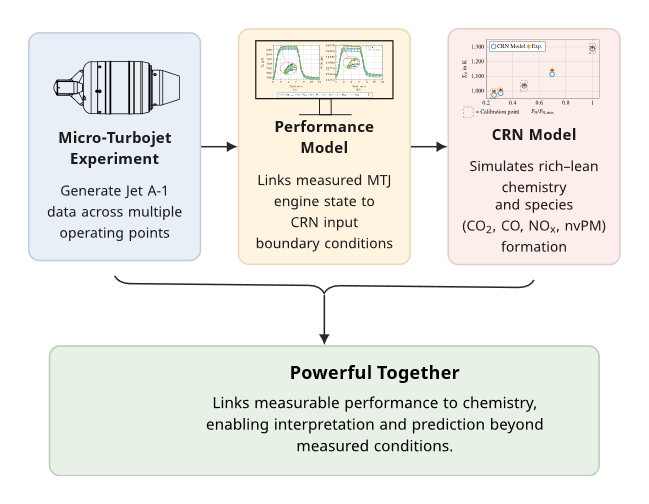
The micro-turbojet makes this testable. Its RQL (rich-burn, quick-quench, lean-burn) reverse-flow combustor follows the same combustion pathway as many full-scale engines. At maximum thrust, its combustor-inlet temperature and pressure are close to those of a turbofan at idle [4]. The match holds at that selected point only. The measured engine state and emissions calibrate the model at some operating points and test it at others.
HowModel structure
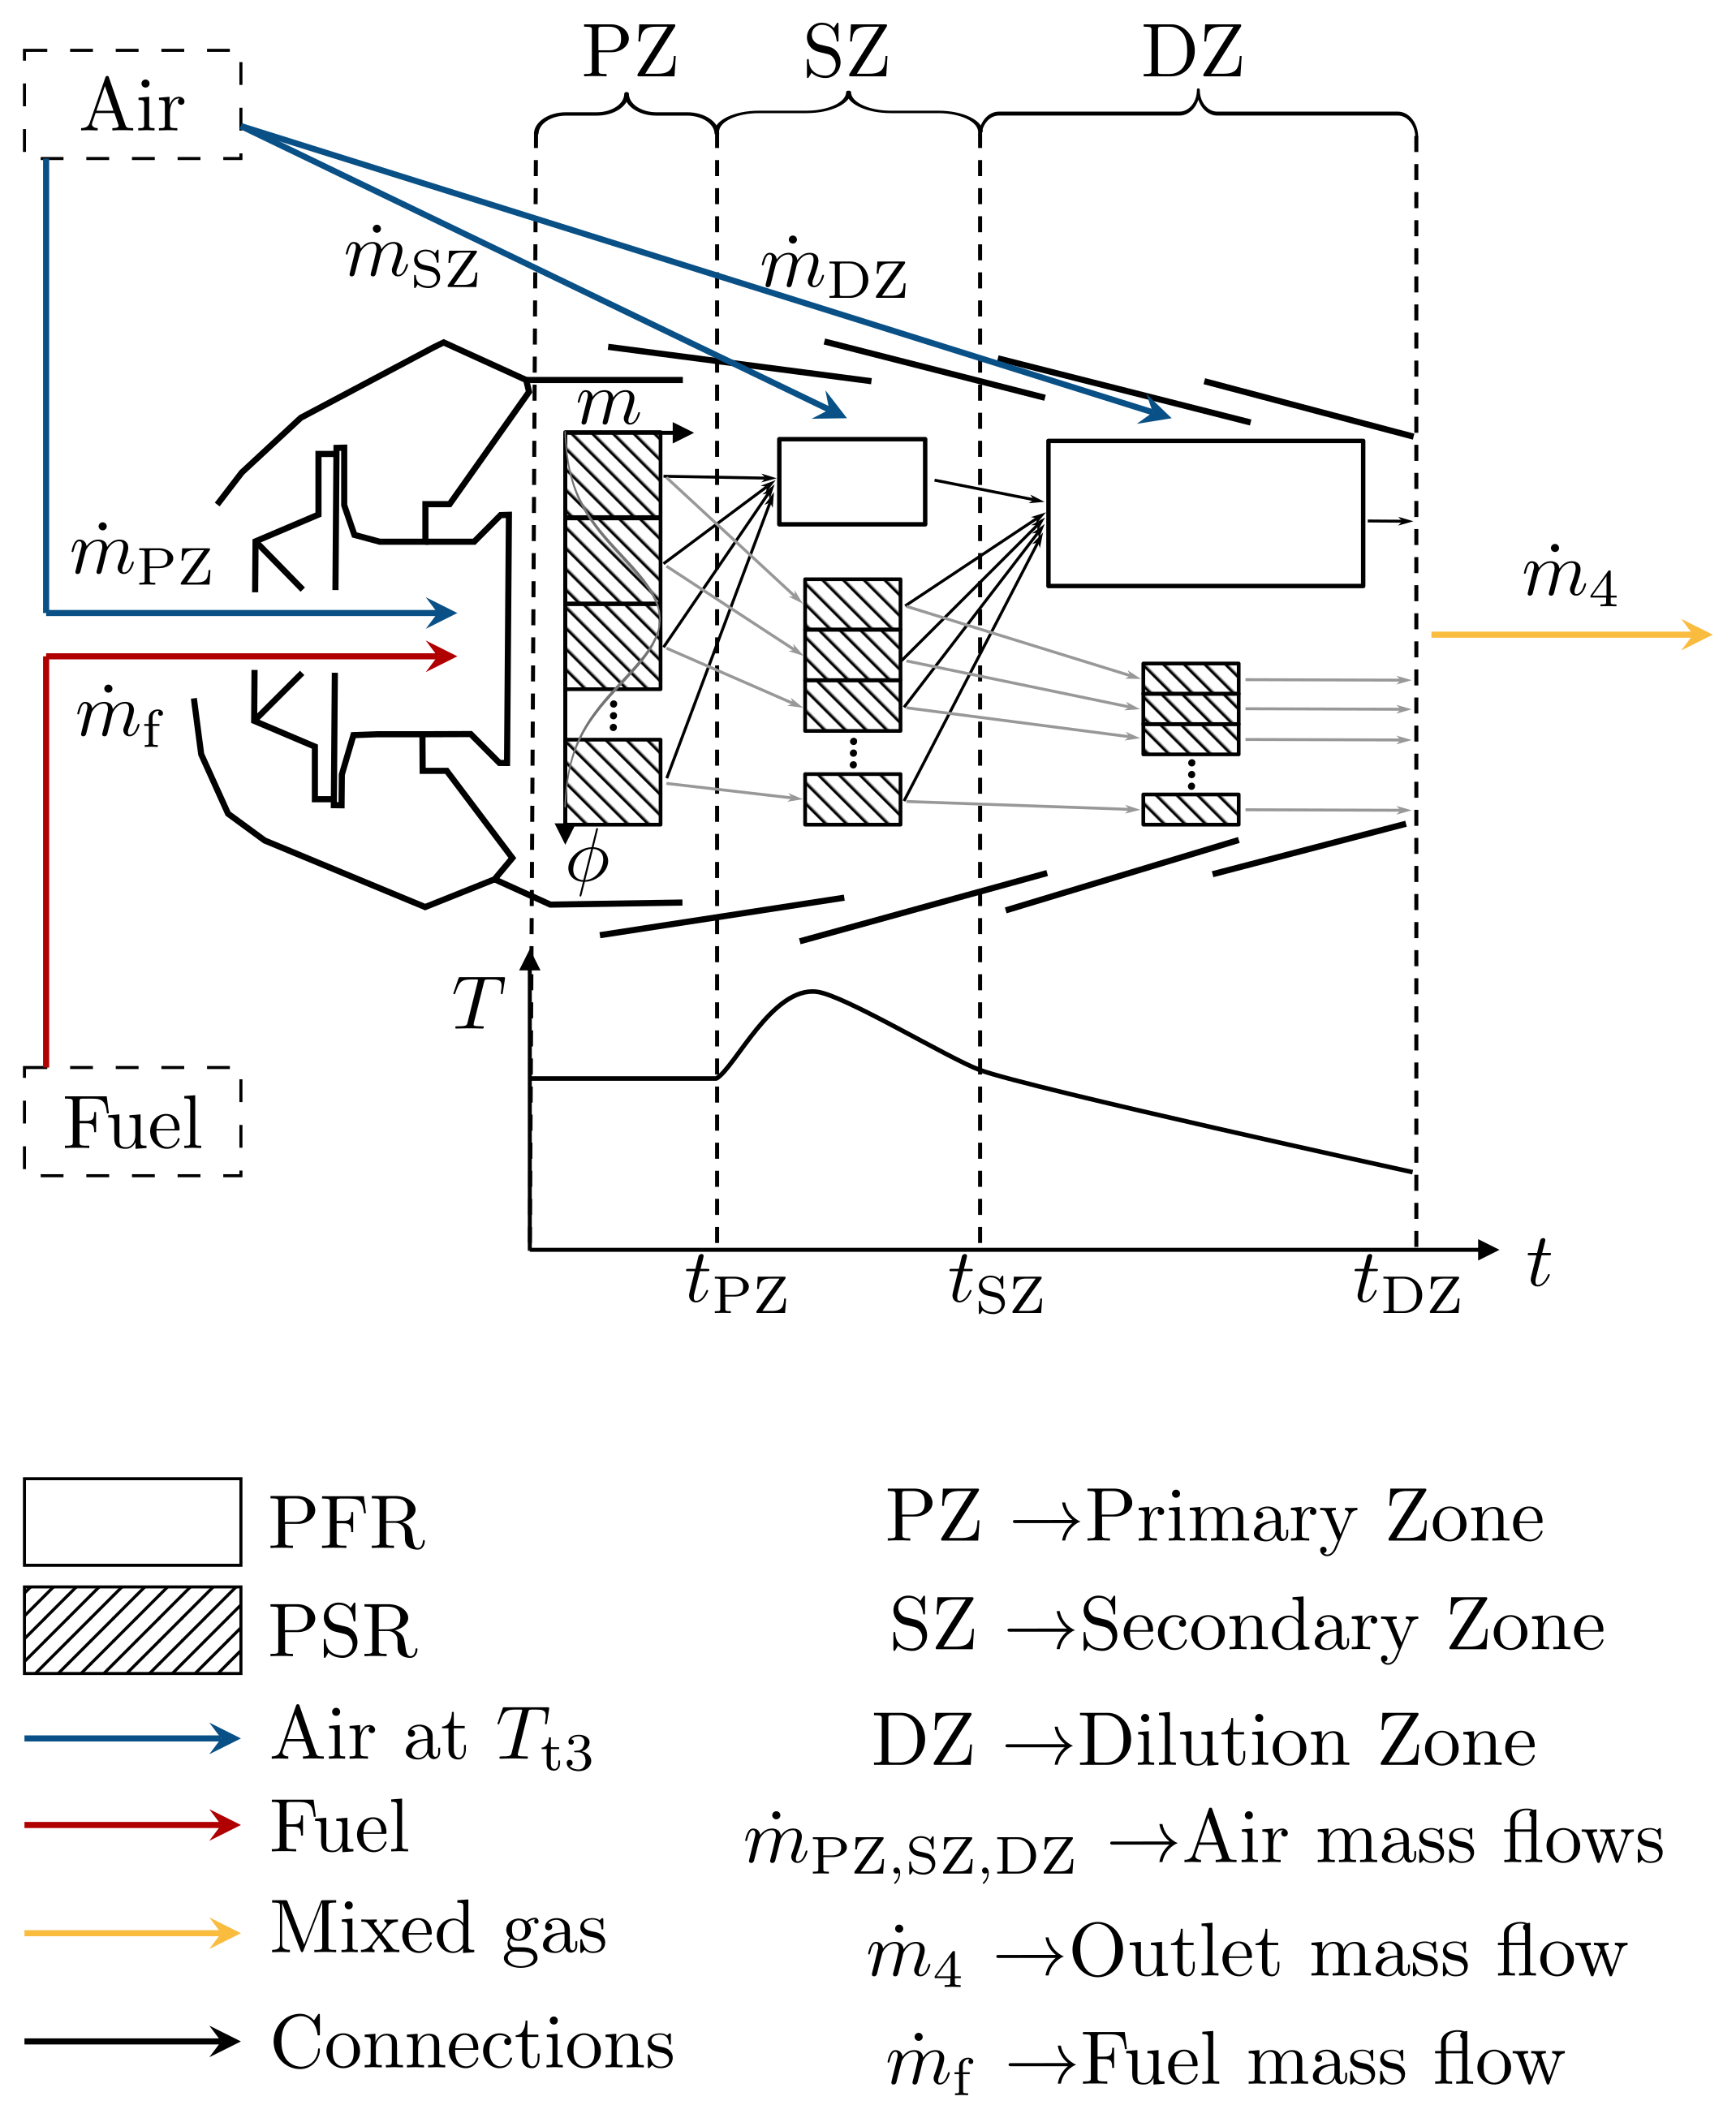
The primary zone is a bank of 21 perfectly stirred reactors. Their equivalence ratios follow a normal distribution, which represents unmixedness. The secondary and dilution zones are plug-flow reactors that keep a fraction of the flow unmixed. At each operating point, the engine performance model supplies \(p_{t3}\), \(T_{t3}\), the air flow and the fuel–air ratio [1, 3]. The air flow is calculated.
Mean primary-zone equivalence ratio, and the width of its distribution from an unmixedness correlation. The 21 reactors cover \(0\) to \(2\phi_{PZ}\) [3].
Air split between zones, and reactor residence time. The calibration parameters are the zone volumes, the air splits and the unmixed fractions.
The chemistry is a finite-rate mechanism with 621 species and 27,829 reactions. It includes a sectional soot model from 2 to 202 nm. It uses surrogate formulations for Jet A-1 (H/C 1.96) and FT-SPK (H/C 2.17) [3]. The calibration searches the parameter space and minimizes the summed error over operating points and targets:
In the ASME study, three operating points (25, 50 and 100% thrust) calibrate the model. Two more (30 and 70%) are held back as validation points [1].
ResultsGas-phase agreement
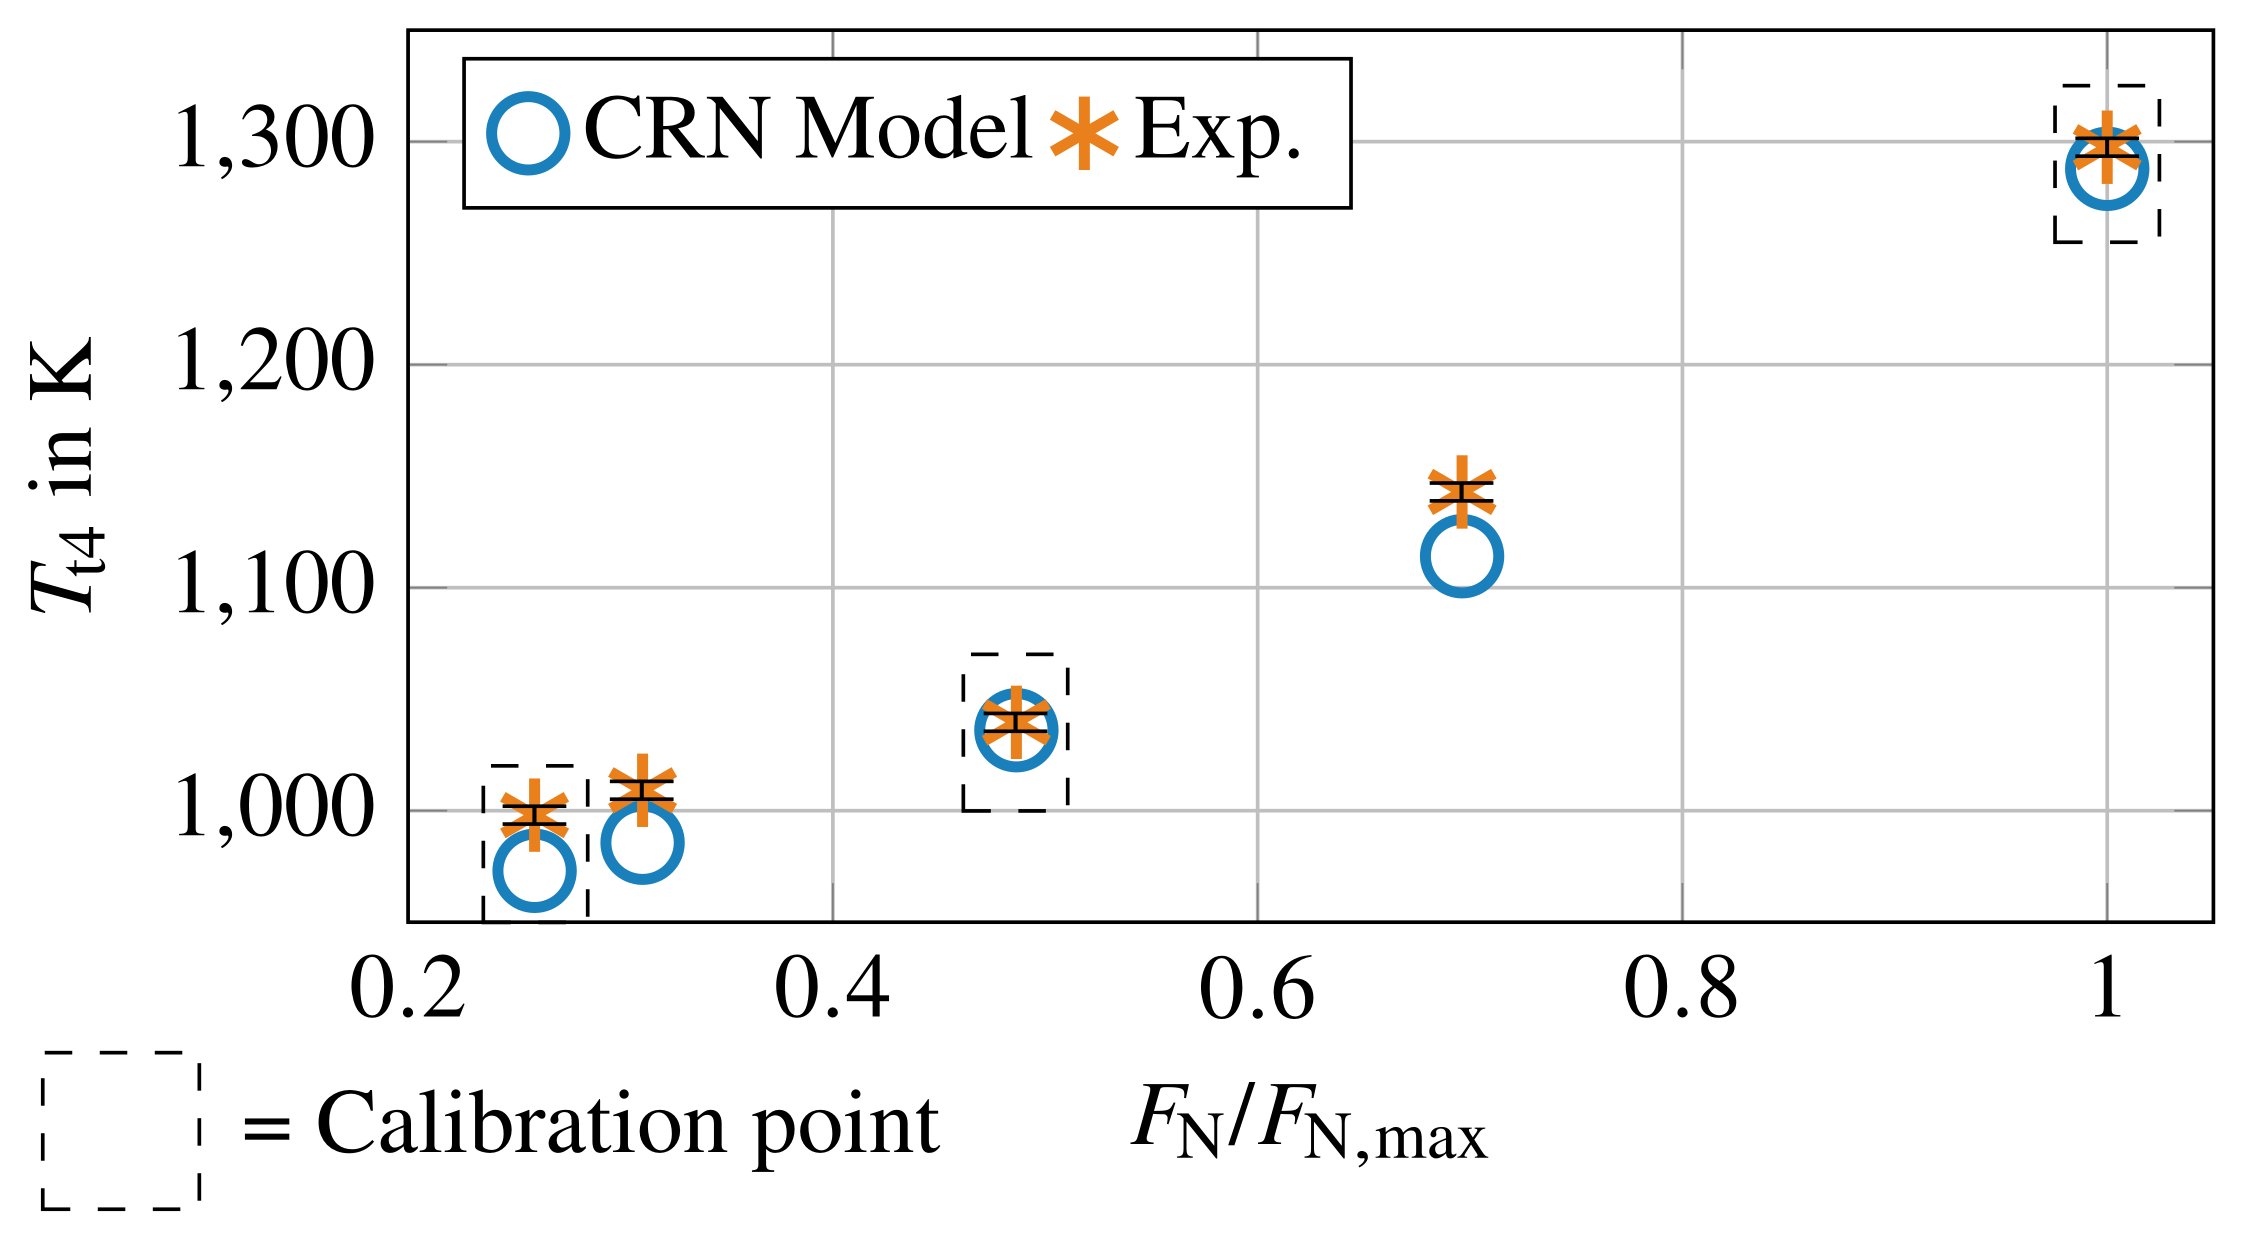
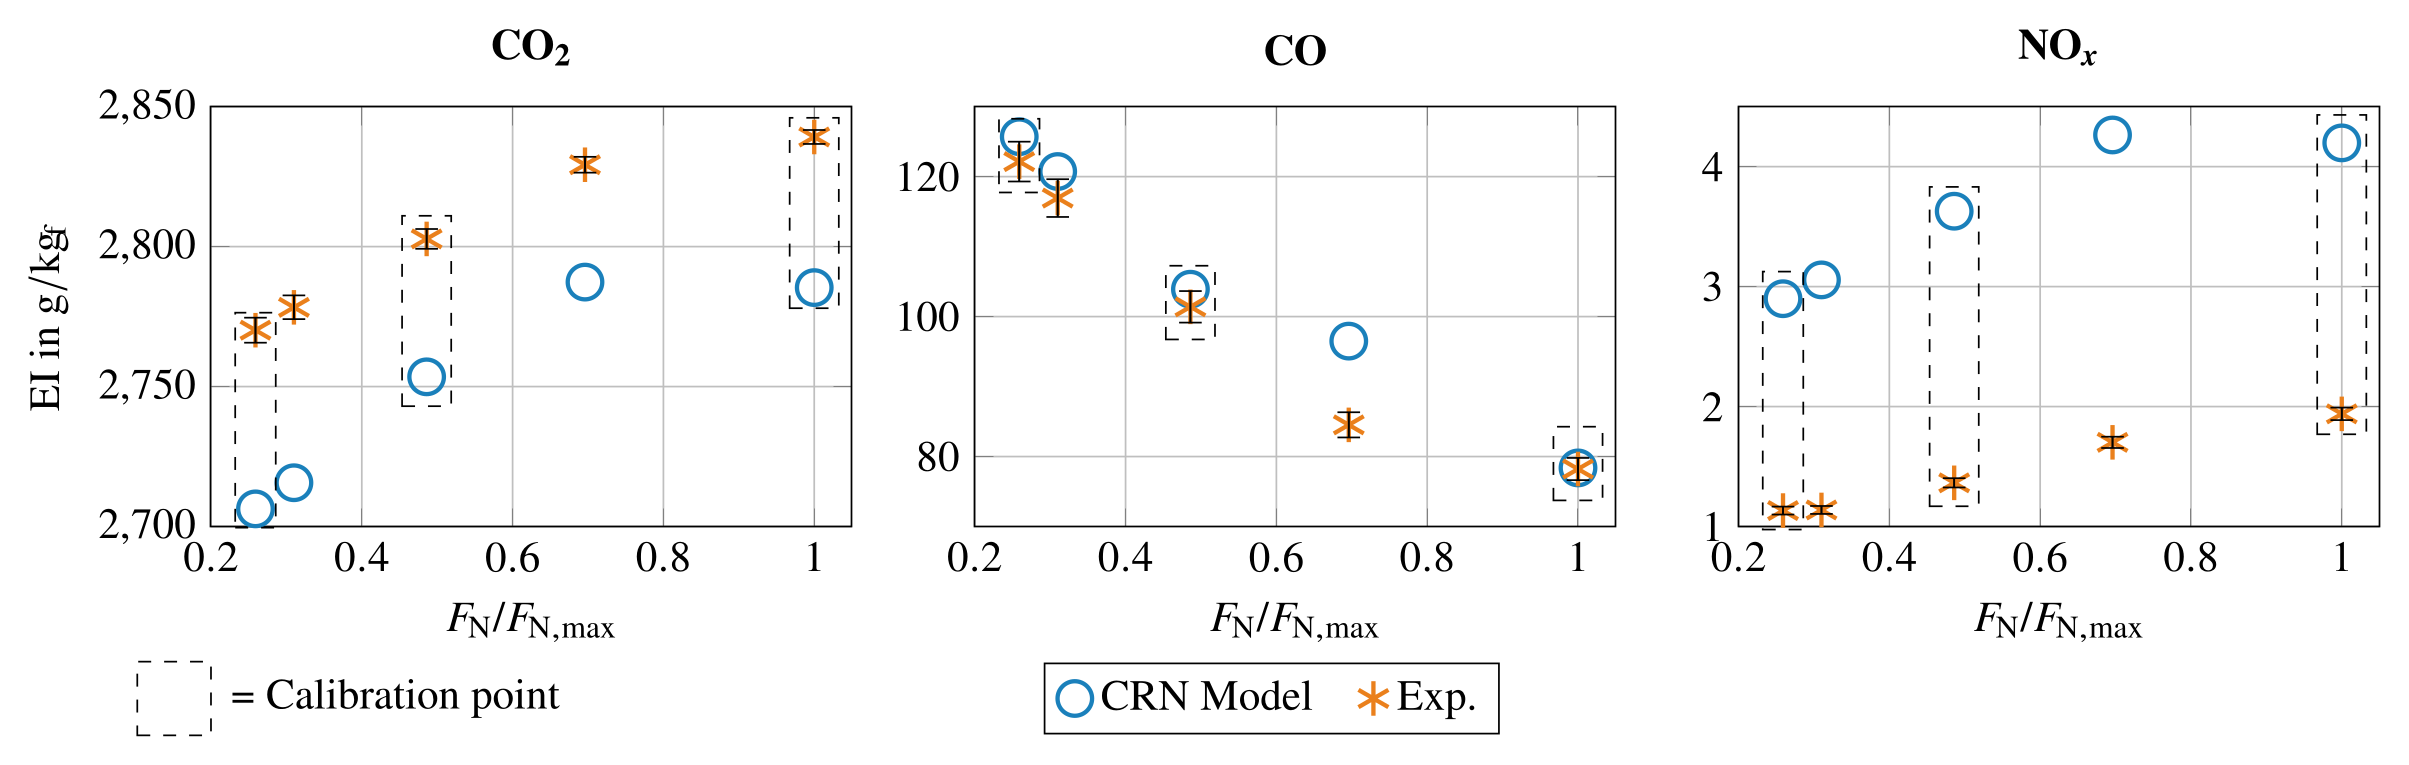
Each result below comes from one campaign. The campaigns differ in date, operating points and model calibration, so their deviations do not combine into one accuracy figure.
ASME study, Jet A-1, five operating points. The model reproduces the measured \(T_{t4}\), EI CO₂ and EI CO with a maximum deviation of 4.5% [1].
The deviations at the two validation points (30 and 70% thrust) stay in the range of the calibration points [1]. The paper takes this as validation of the operating-point trend.
The model overpredicts NOₓ by about 1.8×. The paper links this to the temperature inhomogeneity in the small combustor, which the network does not resolve [1]. The CICS study adds that the model does not include radiative heat loss [2].
CICS study, Jet A-1, three thrust levels. In this campaign, the model overpredicts \(T_{t4}\) by 3–5.5% and CO₂ by 3–3.5%. CO deviates by up to 23% at the highest thrust, and NOₓ is 66–130% high [2].
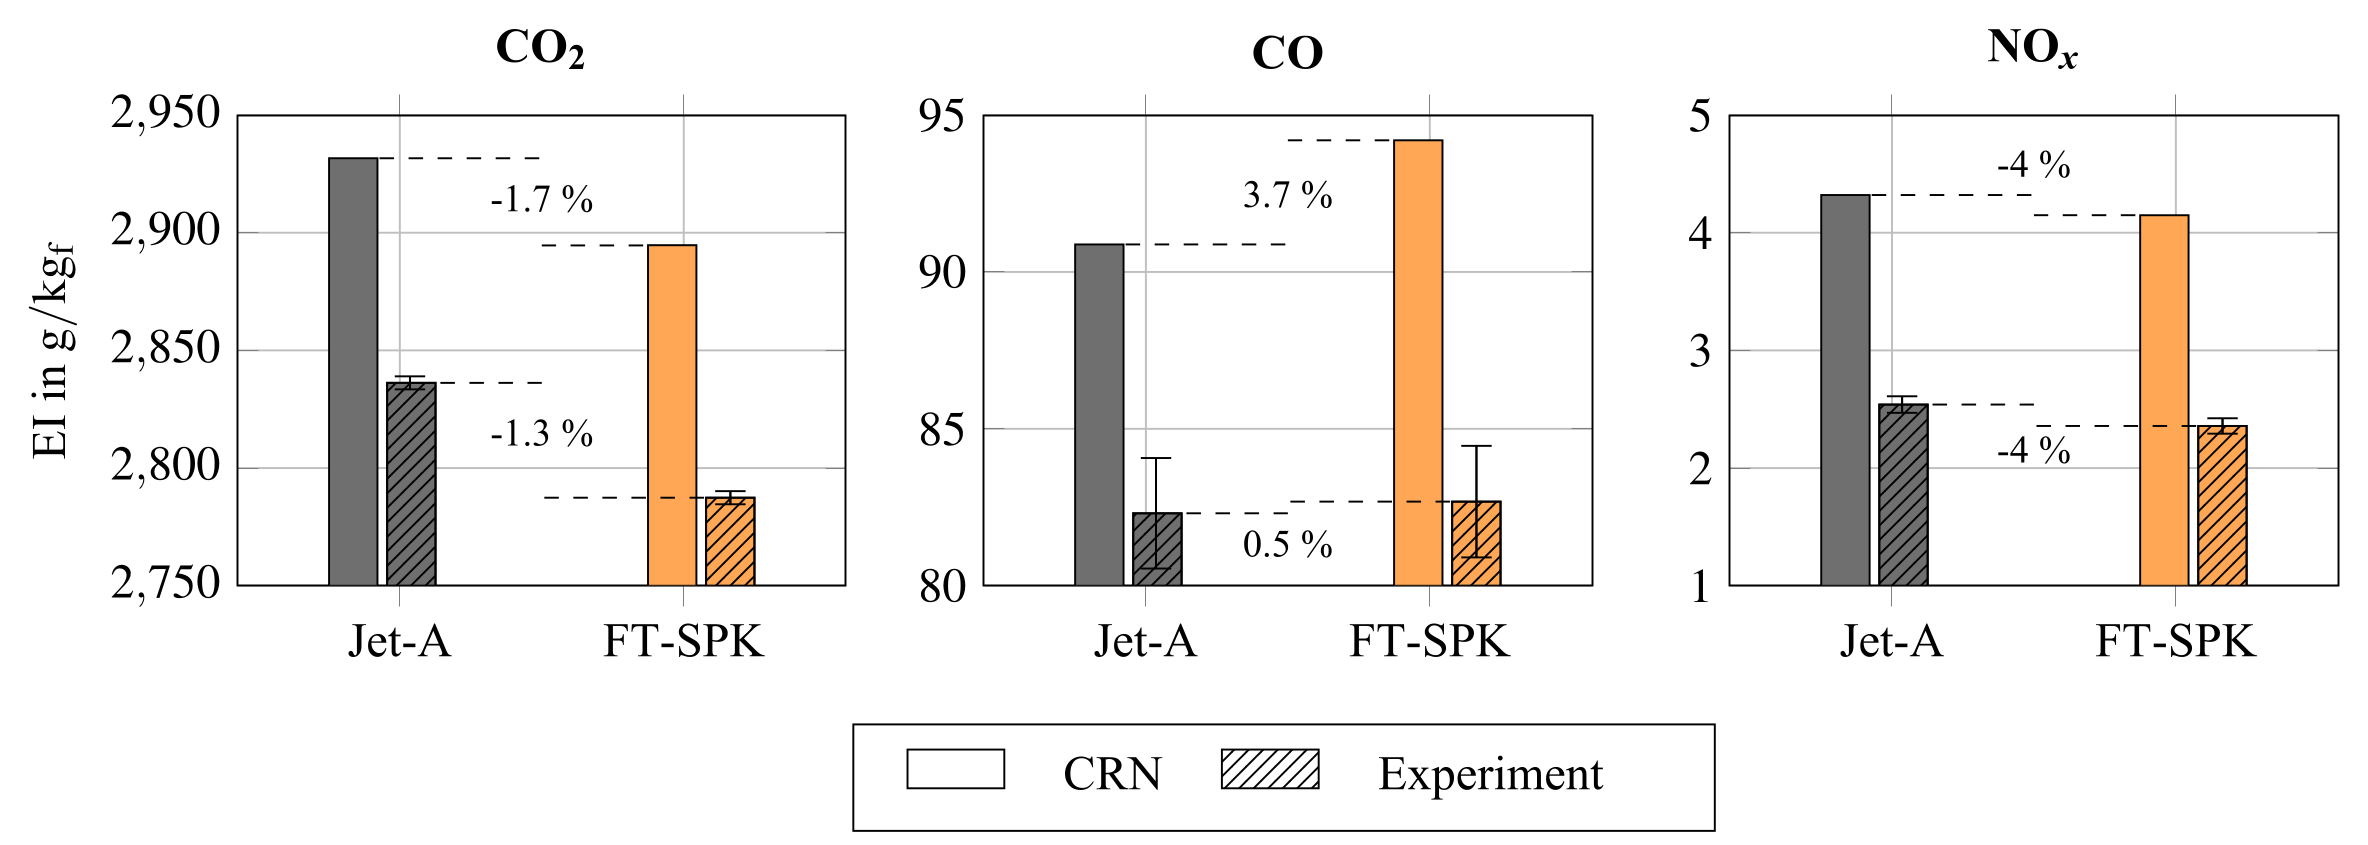
GPPS study, Jet A-1 vs FT-SPK at maximum thrust. The model keeps the same parameters for both fuels, and only the surrogate changes. It predicts the fuel-induced change to within 1 percentage point for \(T_{t4}\), EI CO₂ and EI NOₓ [3]:
| Quantity | Measured change | CRN change | CRN absolute error (Jet A-1 / FT-SPK) |
|---|---|---|---|
| \(T_{t4}\) | −1.5% | −1.8% | +3.4% / +3.0% |
| EI CO₂ | −1.7% | −1.3% | +3.4% / +3.8% |
| EI NOₓ | −4% | −4% | about +70% / +70% |
| EI CO | +0.5% | +3.7% | +10% / +14% |
The model therefore gets the direction and size of the change right for \(T_{t4}\), CO₂ and NOₓ, while the absolute NOₓ stays about 70% high. For CO, it overpredicts the small measured increase.
ResultsParticles: the trend, not the magnitude
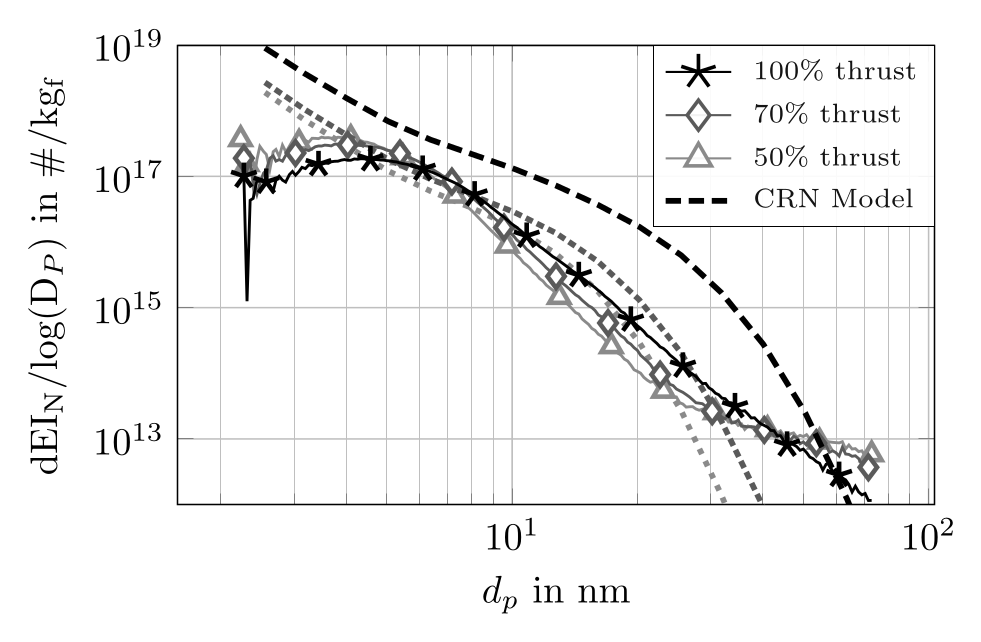
In the CICS Jet A-1 data, the CRN reproduces how the soot size distribution moves with operating point. But it puts the maximum at too small a diameter and overpredicts the small sizes [2]. The loss-corrected distribution maximum is at 3.8, 3.9 and 4.3 nm at 50, 70 and 100% thrust.
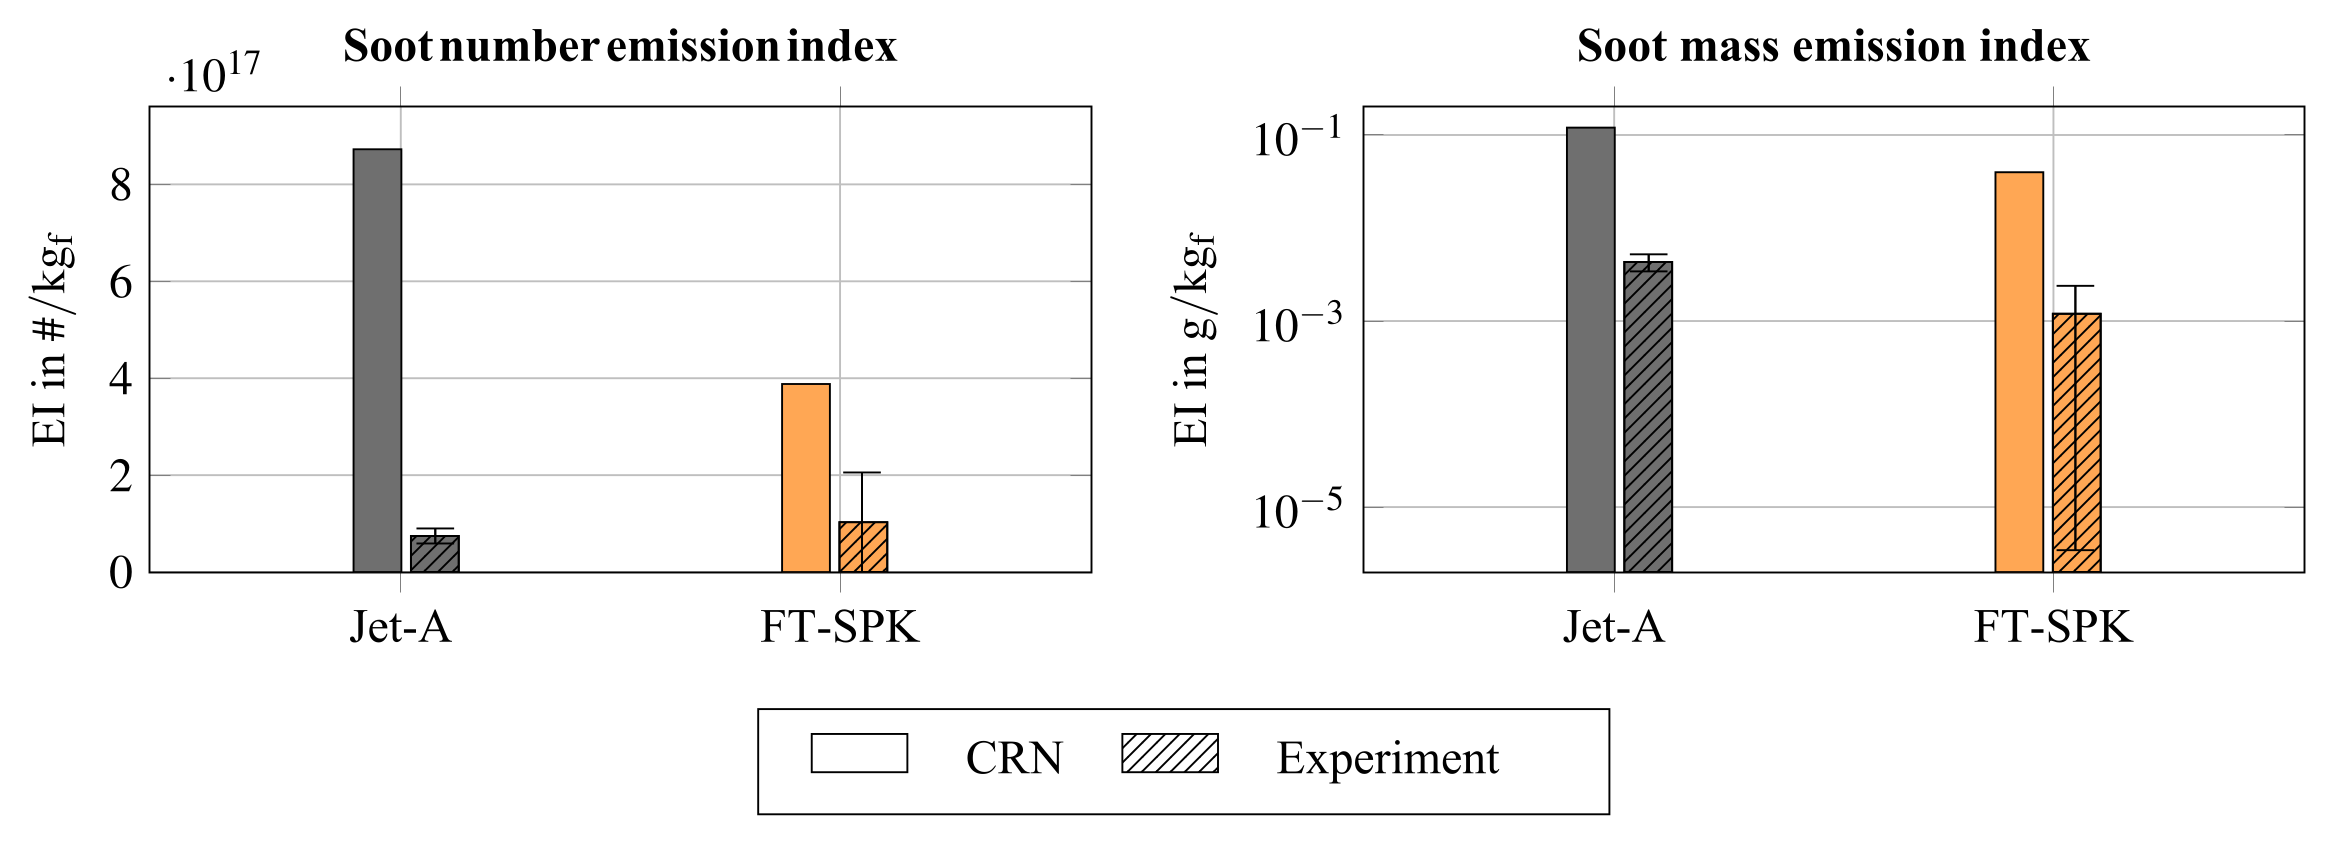
In the GPPS fuel comparison, the measured soot mass fell by 72% with FT-SPK, and the model predicts 67%. The measured mass uses a unit effective density for both fuels [3].
Particle number disagrees. The measured number rose by 38%, while the model predicts a 77% decrease. The measured rise comes only from the smallest bins, where the loss correction is largest. Across almost all other sizes, the measured FT-SPK distribution is lower [3].
The model also overpredicts the absolute soot mass by a factor of 20–26 and the number by a factor of 8–11 [3]. Particle formation is the weakest part of the network.
MethodsScaling to a full-size engine
The ASME study recalibrates the CRN for an IAE V2500-A1 with ICAO certification data at the four LTO points. No separate validation points exist for that engine [1]. The recalibrated model matches the ICAO data within 18.2% for CO and 8.3% for NOₓ.
The study then compares two methods that predict emissions along a full flight trajectory: the CRN coupled to an engine performance model, and BFFM2. The two differ by up to 30% in CO at static sea level, and by up to 60% in flight [1]. No full-scale measurement exists along the trajectory, so this compares the methods with each other.
The paper attributes the larger in-flight difference to the CRN modeling altitude and Mach-number effects that BFFM2 only corrects for [1]. The micro-turbojet and V2500 models also show similar zone-by-zone progressions. That supports transferring the model structure to the larger engine.
References
- [1]D. Lieder, S. Sharma, P. Kirchen, S. Rogak and J. Goeing, “Development of a validated chemical reactor network model for non-CO₂ emissions in RQL aircraft combustors,” ASME Journal of Engineering for Gas Turbines and Power, accepted (GTP-26-1516); Proc. ASME Turbo Expo 2026, GT2026-177253, Milan.
- [2]S. Sharma, D. Lieder, N. Sapkota, H. Lintusaari, A. Kumar, P. Kirchen, J. Goeing and S. Rogak, “Experimental and model characterization of jet fuel emissions in a micro-turbojet engine,” Combustion Institute – Canadian Section Spring Technical Meeting, Concordia University, May 2026 (non-archival).
- [3]D. Lieder, S. Sharma, H. Lintusaari, N. Sapkota, A. Kumar, P. Kirchen, J. Friedrichs, S. Rogak and J. Goeing, “Measurement and prediction of particle emissions from a micro turbojet using conventional and alternative jet fuel,” Proc. GPPS Montreal26, GPPS-TC-2026-102, 2026, doi:10.33737/gpps26-tc-102. © the authors, CC BY-NC-ND 4.0.
- [4]S. Sharma, D. Lieder, S. Saini, A. Kumar, P. Kirchen, J. Goeing and S. Rogak, “A micro-turbojet test rig to analyze the impact of jet fuels on emissions and performance,” Proc. CSME International Congress / 33rd Annual Conf. CFD Society of Canada, Vancouver, May 2026, Paper 361.