Apollo Ascent Engine Nozzle: A Staged-Fidelity CFD Hierarchy
Independent computational studyA personal project to build rocket-nozzle CFD from the ground up. The test bed is the chamber and bell nozzle of the Apollo Lunar Module ascent engine. Each simulation adds exactly one piece of physics to the last. The sequence is 1-D theory, inviscid flow, a thermally perfect gas, viscous flow, turbulent flow and finally the plume. This shows me what each layer of fidelity actually buys. It also shows, very visually, how a nozzle designed for vacuum over-expands and separates against sea-level back pressure.
WhatWhy build it one layer at a time
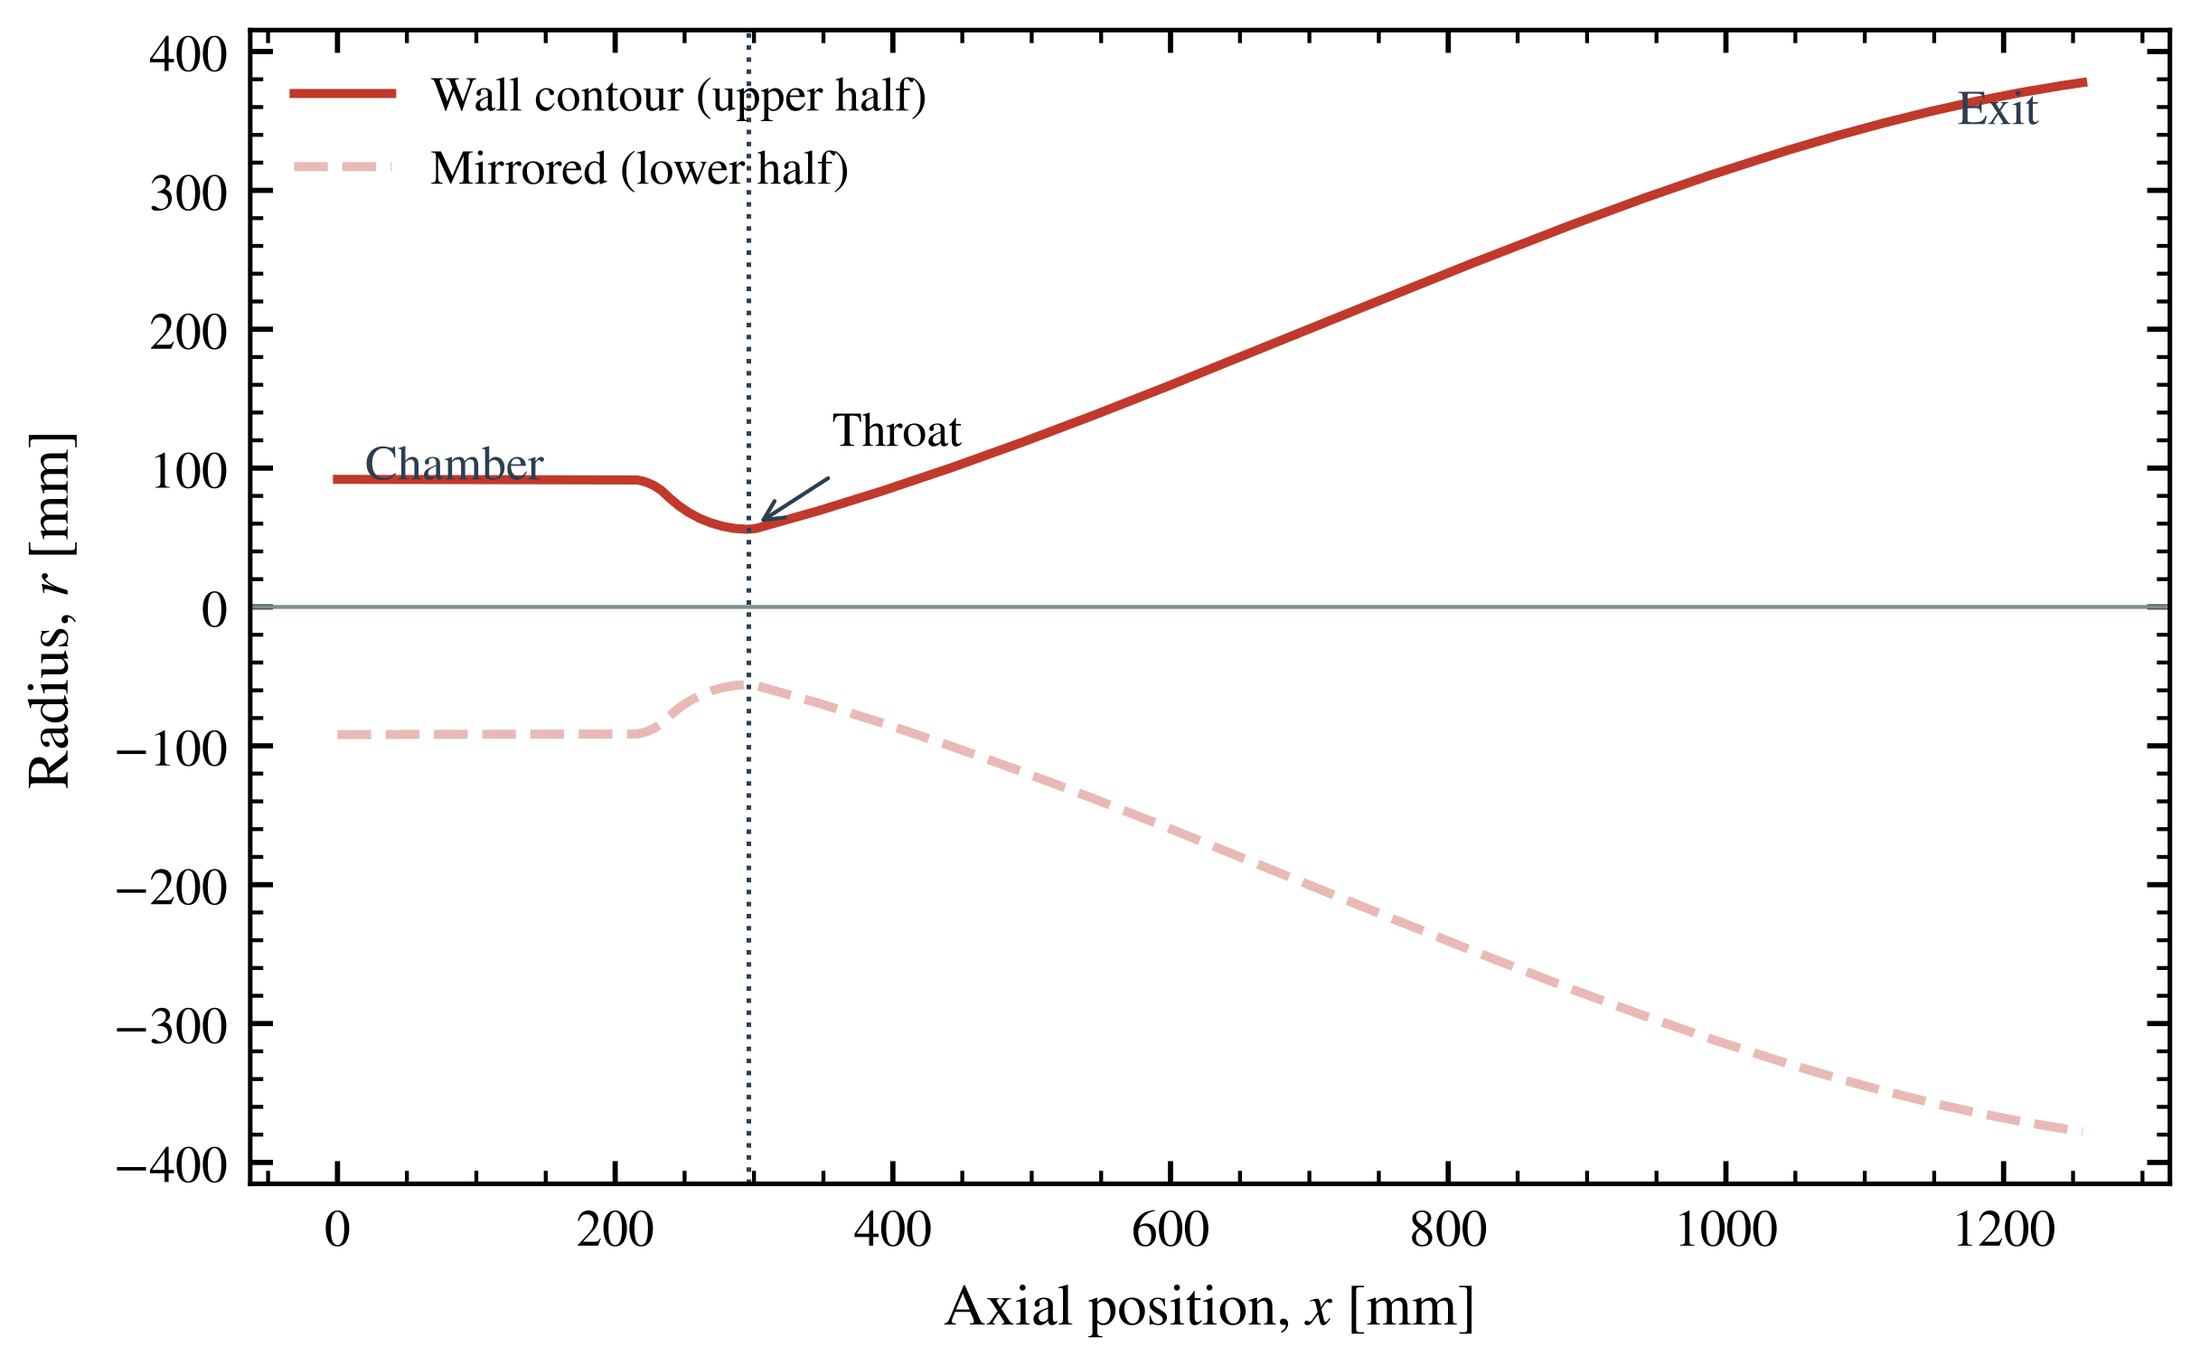
High-fidelity rocket CFD fails in ways that are hard to diagnose when all physical effects are active at once. I went the other way. I start from a model that I can check by hand and add one effect per case. I explain every change in the answer before I move on. The ascent engine is a good test bed because its geometry is well documented. It has a 91.9 mm chamber radius, a 55.9 mm throat and a 377.7 mm exit, an area ratio of 45.6 over 1.26 m [1].
Real Aerozine-50/N₂O₄ chemistry is out of scope by design. I did not derive or use a kinetic mechanism for it, or for any other hypergolic propellant. A generic, non-reacting CH₄/O₂ surrogate stands in for the real propellants throughout. Its chamber state is a Cantera equilibrium at O/F 3.5, about 3,334 K and the nominal 0.848 MPa of the engine. The composition then stays frozen through the nozzle [9]. This keeps the fluid dynamics honest, but the thrust and specific impulse are not Apollo numbers.
| Case | What it adds | Cells |
|---|---|---|
| 00 | Independent quasi-1-D isentropic solver along the contour | 1-D |
| 01 | 2-D axisymmetric, inviscid, constant heat capacity (γ = 1.209) | 10,000 |
| 02 | Temperature-dependent heat capacity (NASA-7 fit, frozen composition) | 10,000 |
| 03 | Viscosity and a no-slip wall (laminar), first cell sized for y⁺ ≈ 1 | 16,800 |
| 04 | k–ω SST turbulence with a low-Re wall treatment | 16,800 |
| 05 | External plume domain with a transported mixture fraction | 36,900 |
Like the Sandia work, this runs on my gaming laptop. The hardware and its limits are on the Sandia Flame D page. A fine nozzle-and-plume domain does not fit in it. I build the case in steps and keep each mesh as small as the physics allows. Annoying, but it forces good case design.
HowThe physics in each layer
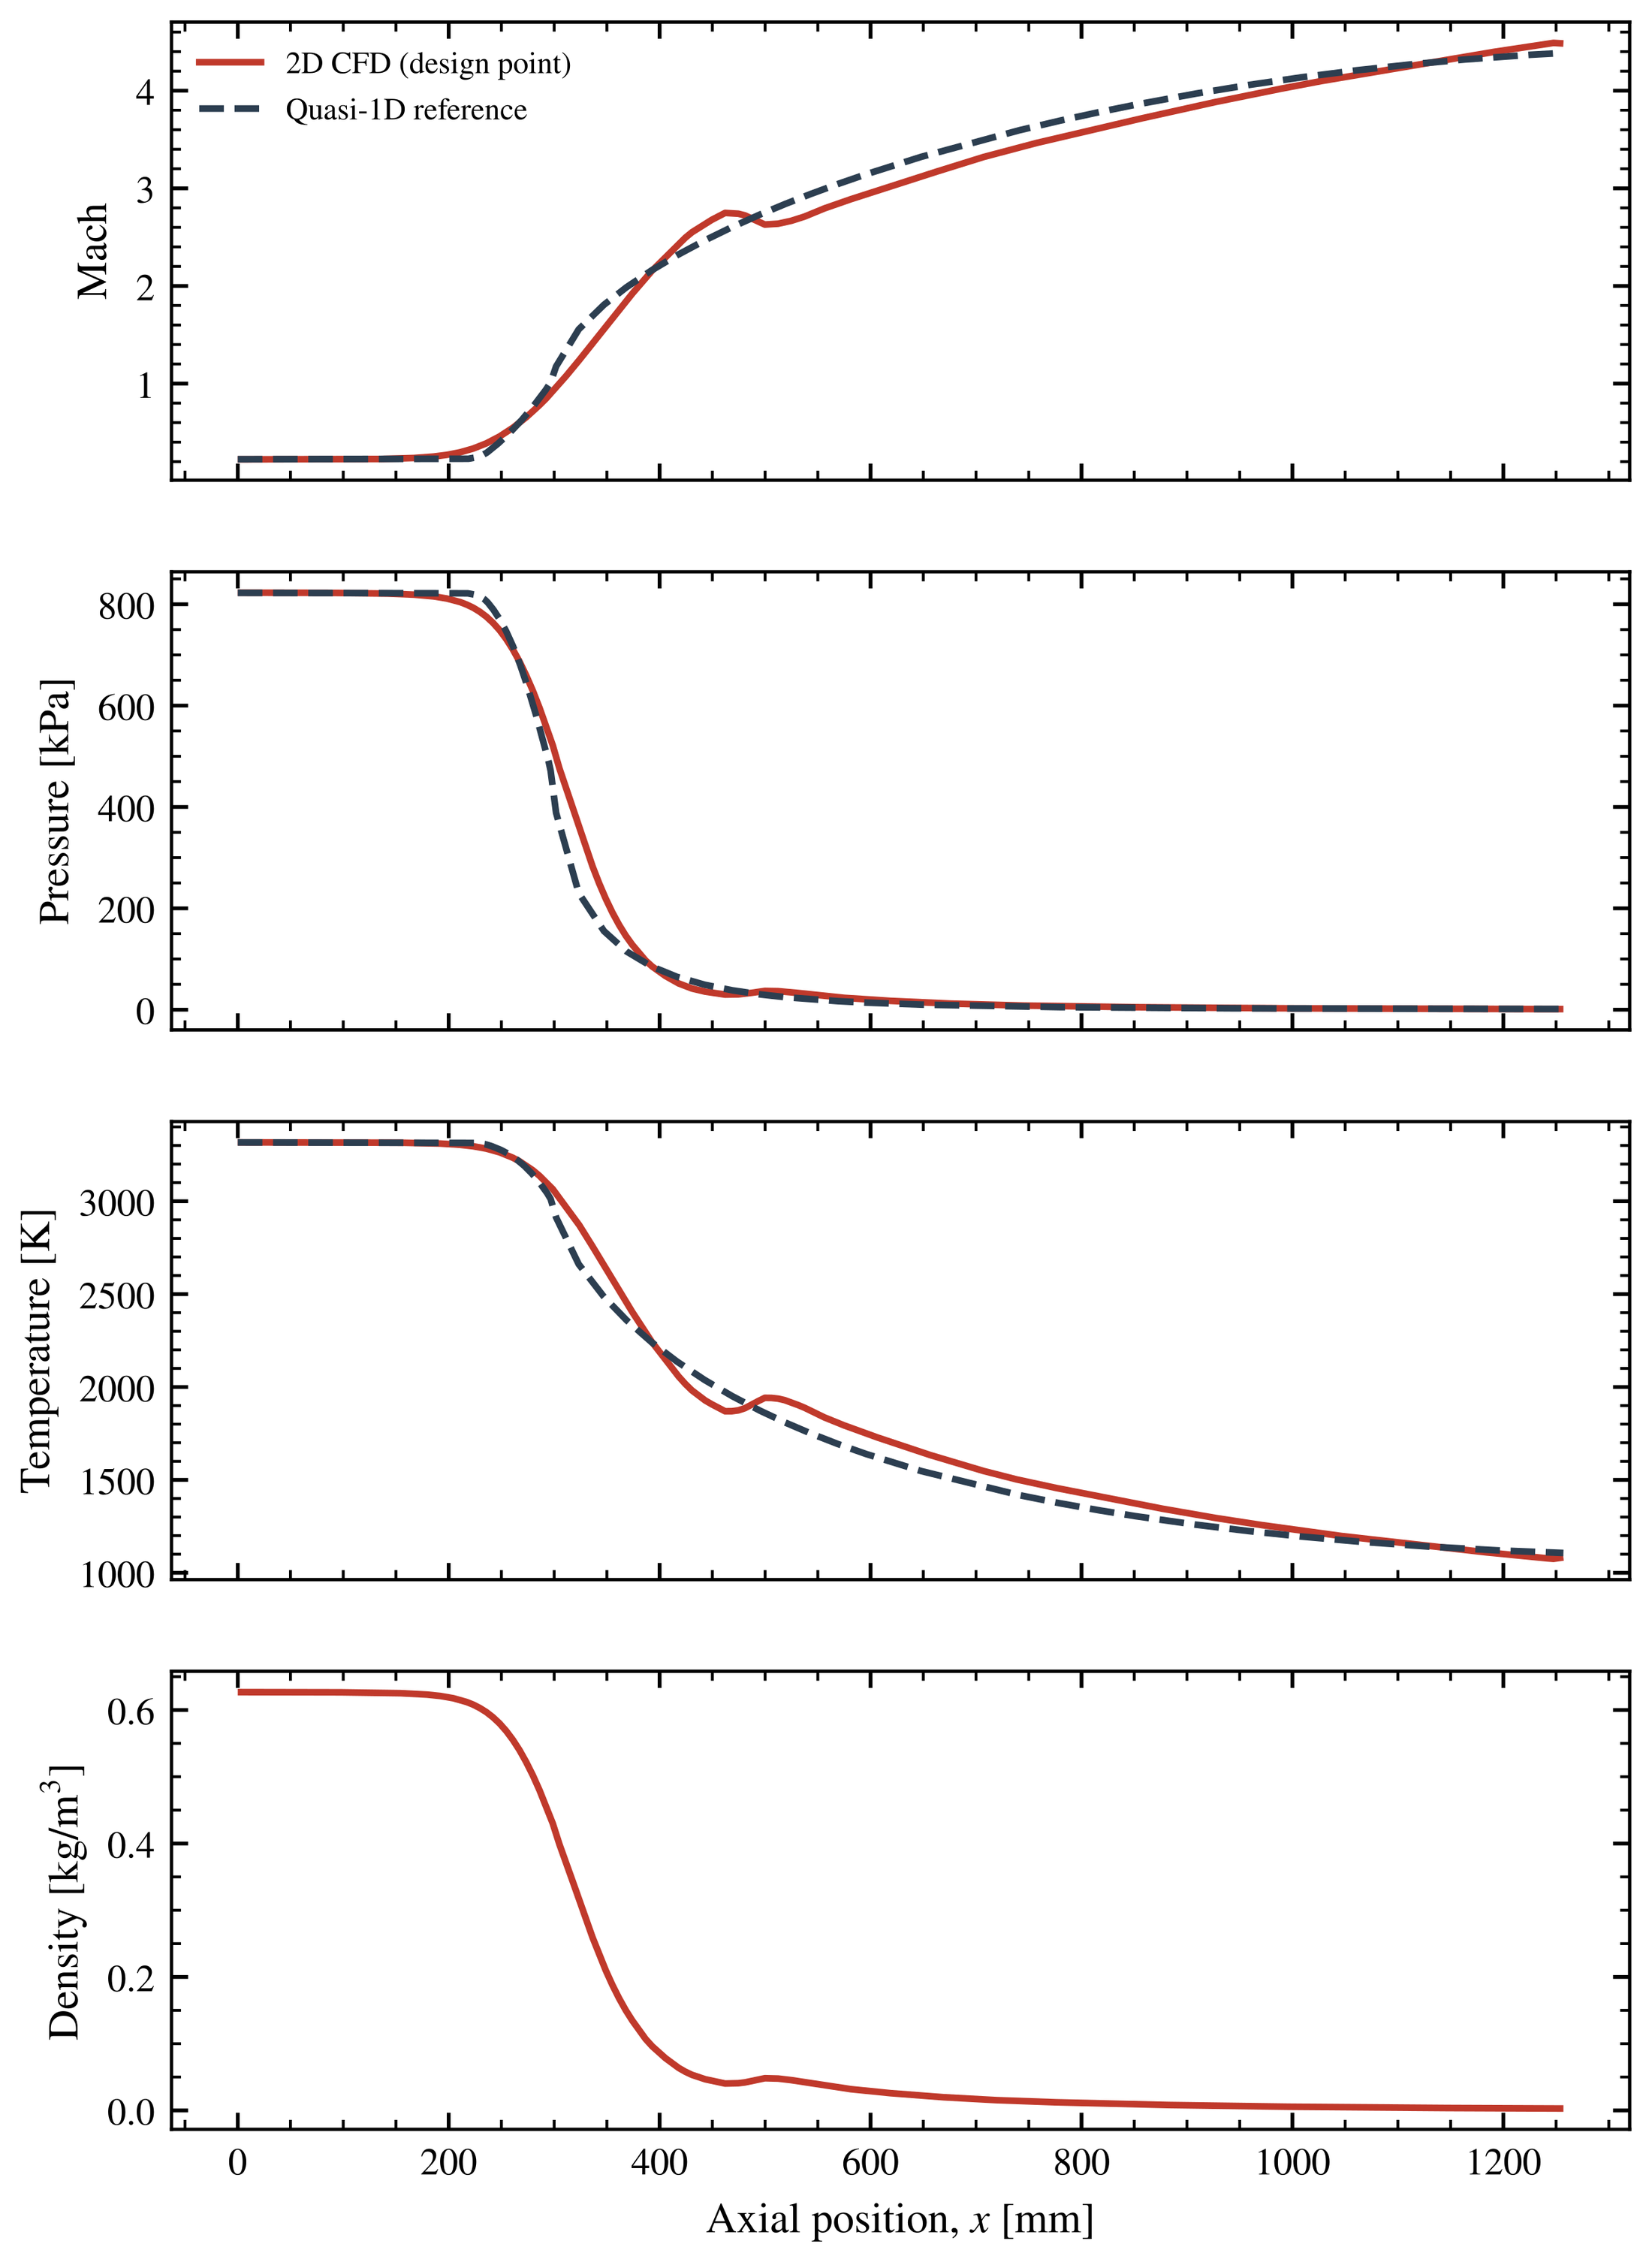
The 2-D cases use rhoCentralFoam, the density-based, shock-capturing solver in OpenFOAM, with Kurganov–Tadmor central-upwind fluxes [4, 5]. Case 00 is the textbook reference. It inverts the area–Mach relation along the contour, then computes thrust from the exit plane. That thrust includes the pressure term, which becomes the whole story off design [2, 3]:
The area–Mach relation, thrust with the pressure term \((p_e-p_a)A_e\), and specific impulse. At \(\gamma=1.209\), an area ratio of 45.6 gives an exit Mach number of 4.39.
Then the physics goes in. Case 02 lets the heat capacity follow temperature, so the local γ changes through the nozzle. Case 03 adds viscosity with a Sutherland fit and a no-slip wall. Its mesh puts the first cell at y⁺ below 1. Case 04 adds the SST model of Menter. Its limiter keeps the eddy viscosity bounded through the strong gradients at the throat [6]:
Sutherland viscosity, the SST eddy-viscosity limiter and the wall coordinate used to size the first cell.
The boundaries took the most effort. A plain zero-gradient outlet crashed five consecutive starts, and a non-reflecting outlet fixed that. A second bug was a sustained acoustic resonance. It came from a relaxation length that I copied from a 30 mm tutorial, and rescaling that length to this domain cured it [7].
ResultsWhat each layer of fidelity buys
| Case | Exit T | Exit p | Exit speed | Vacuum thrust | Isp,vac* | Mass imbalance |
|---|---|---|---|---|---|---|
| 00 quasi-1-D | 1,107 K | 1,444 Pa | 3,192 m/s | 15,709 N | 339.5 s | — |
| 01 inviscid | 1,129 K | 1,728 Pa | 3,171 m/s | 15,342 N | 333.4 s | 0.05% |
| 02 + Cp(T) | 972 K | 1,527 Pa | 3,148 m/s | 15,150 N | 329.0 s | 0.003% |
| 03 + viscosity | 1,010 K | 1,611 Pa | 3,115 m/s | 15,010 N | 327.1 s | 0.16% |
| 04 + SST | 1,021 K | 1,540 Pa | 3,112 m/s | 14,890 N | 326.0 s | 0.05% |
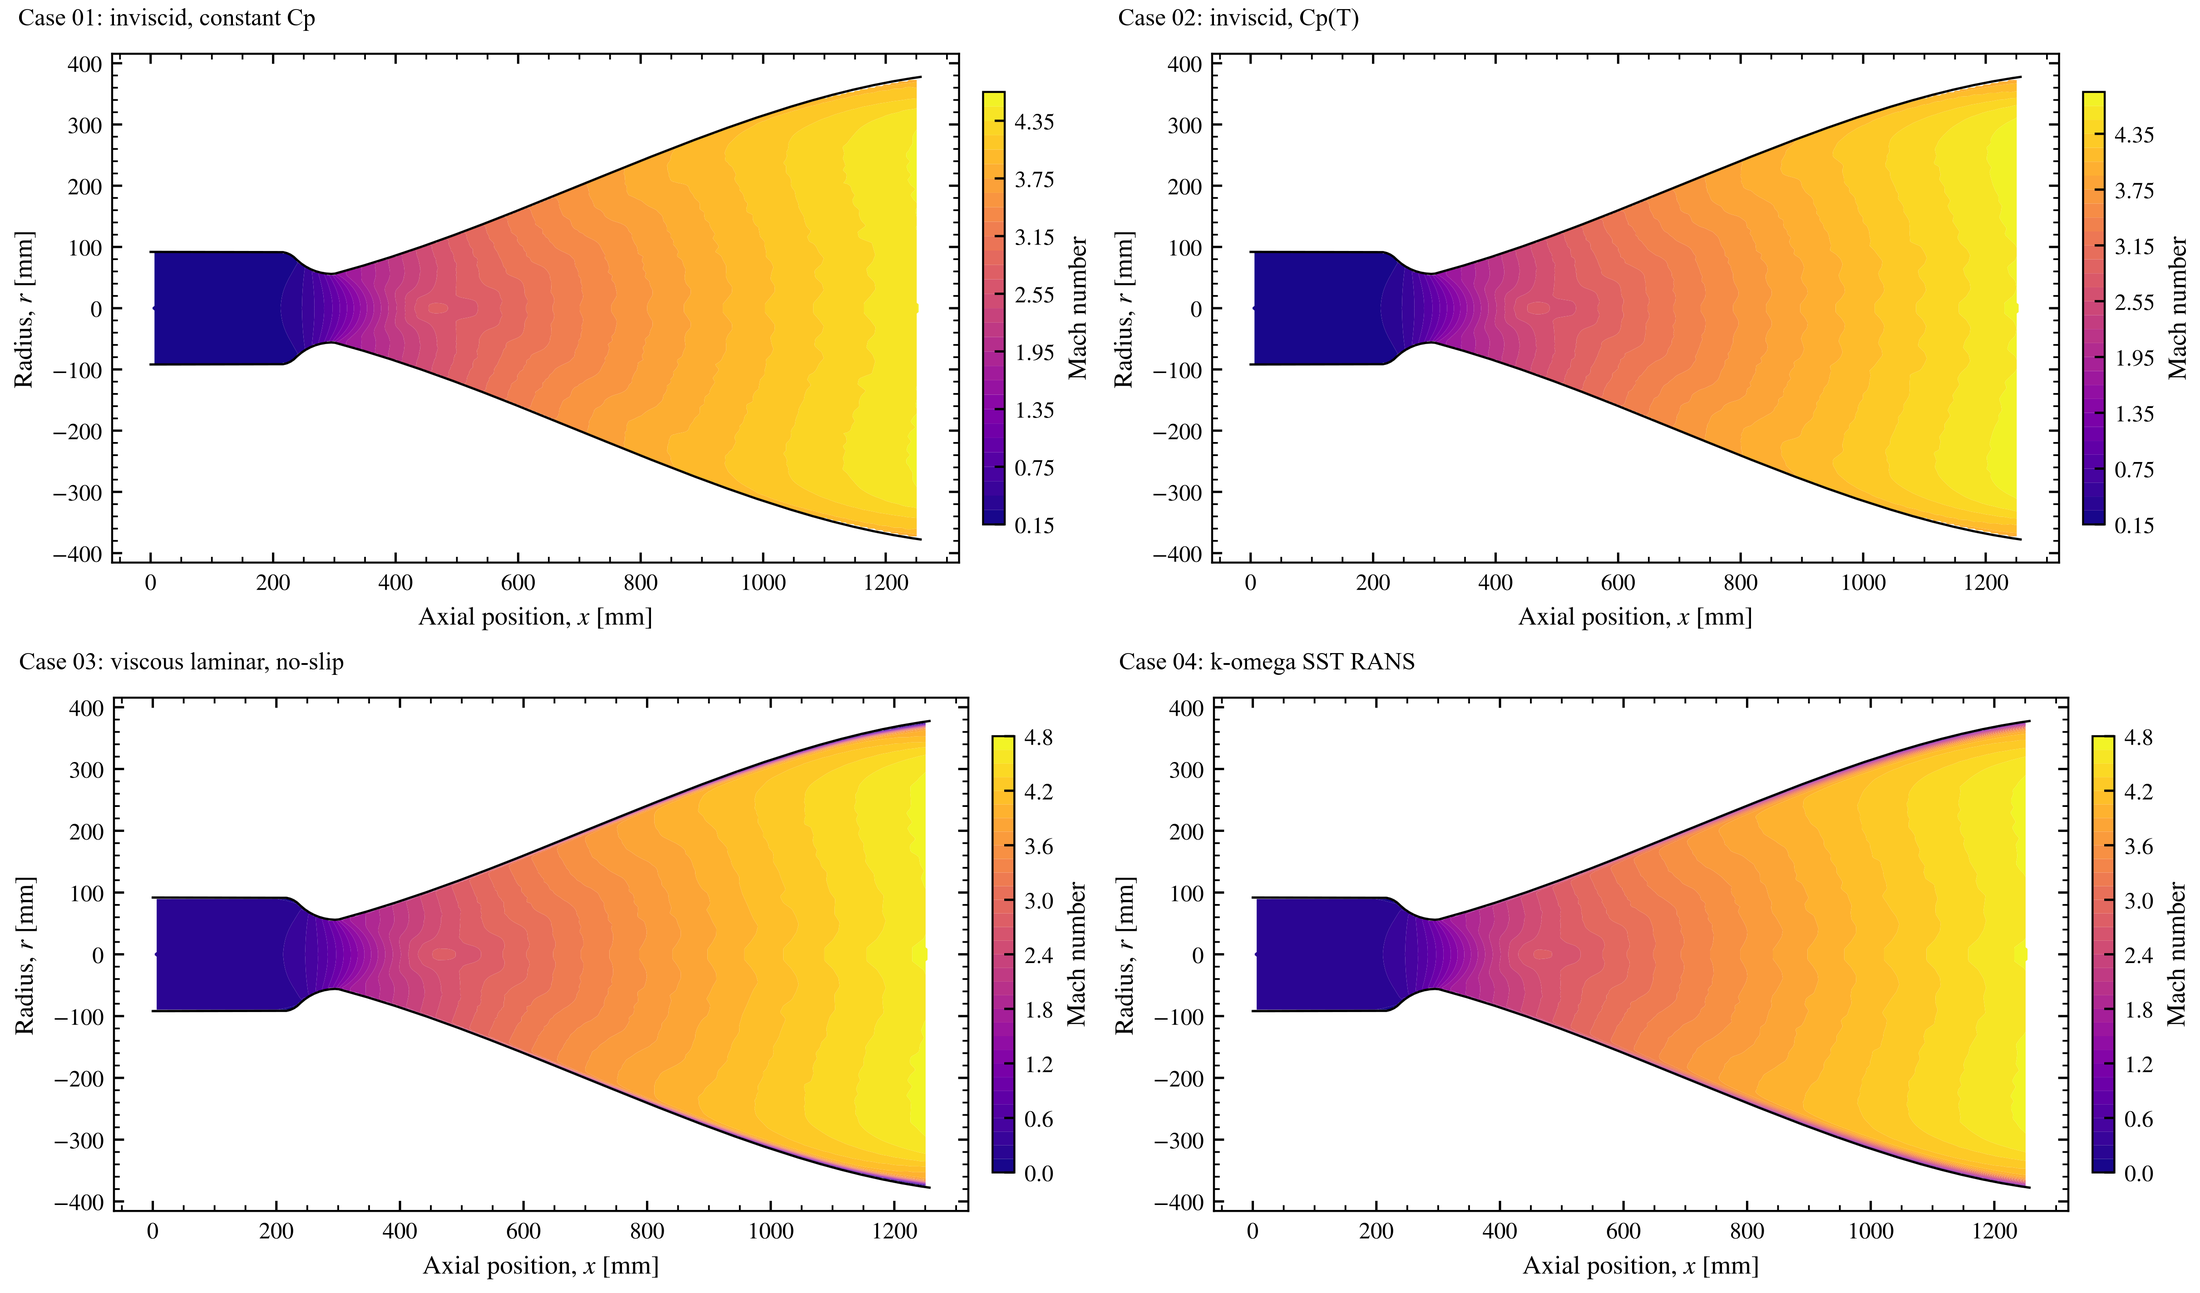
- 2-D vs 1-D (Case 01): the exit speed agrees within 0.7%, but thrust drops 2.3%. The main reason is that 2-D flow leaves the bell with a radial velocity component (about 647 m/s), which 1-D theory ignores.
- Temperature-dependent heat capacity (Case 02): the biggest change in the temperature field (the exit is 14% cooler), but only 1.3% in thrust. Most of the energy is already kinetic by the exit.
- Viscosity (Case 03): a thin, hot boundary layer and wall friction cost another 0.9% of thrust. The core flow barely moves.
- Turbulence (Case 04): modeled turbulent stresses make the layer slightly thicker (−0.8%). On the centerline the solution is almost unchanged.
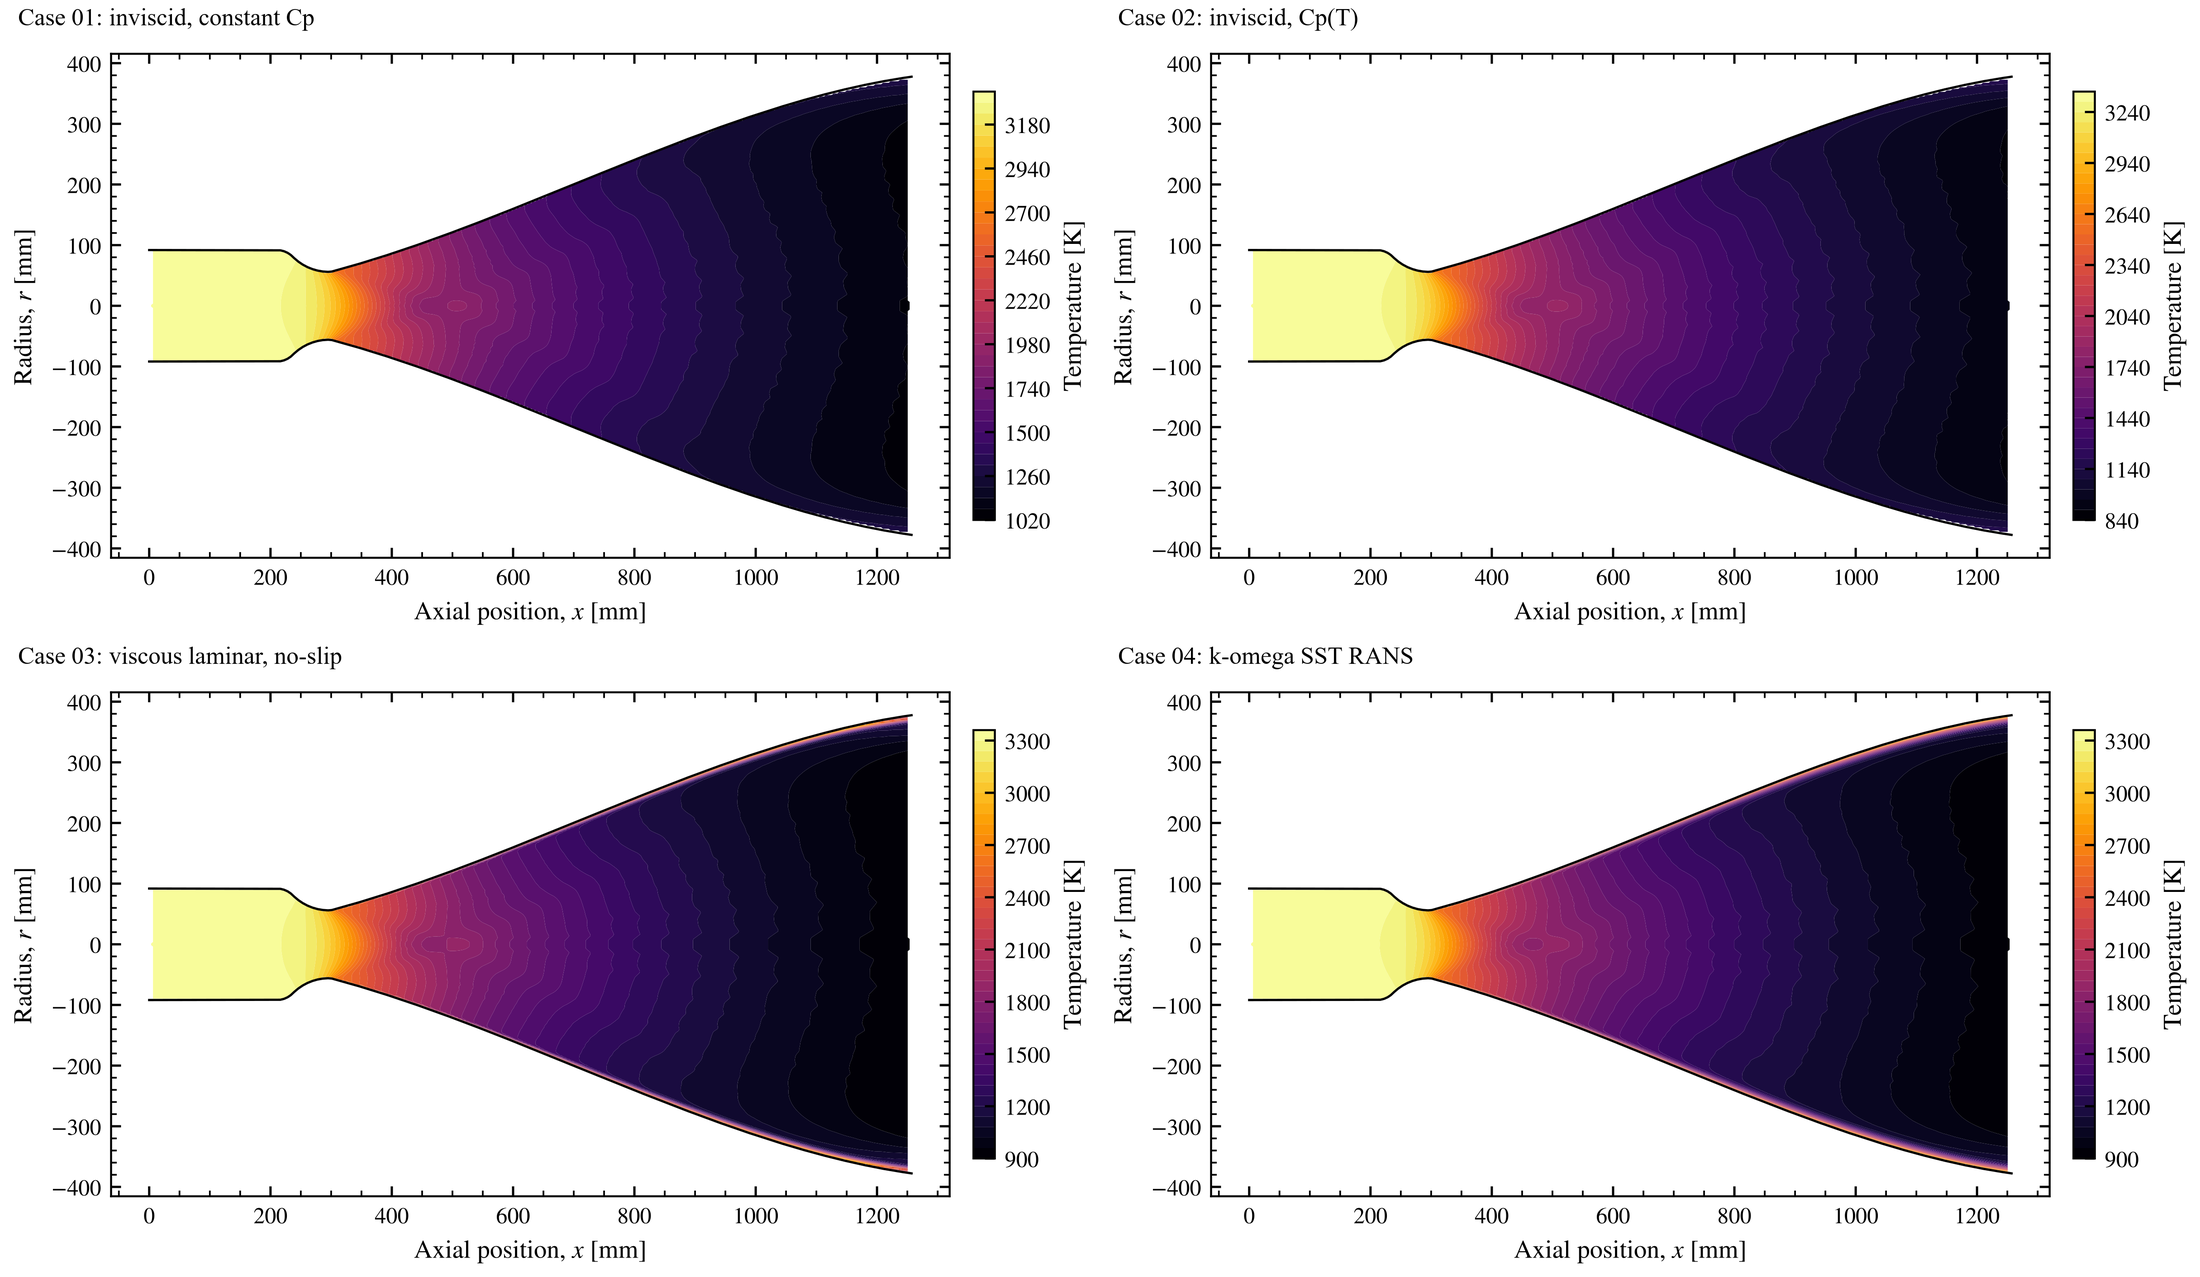
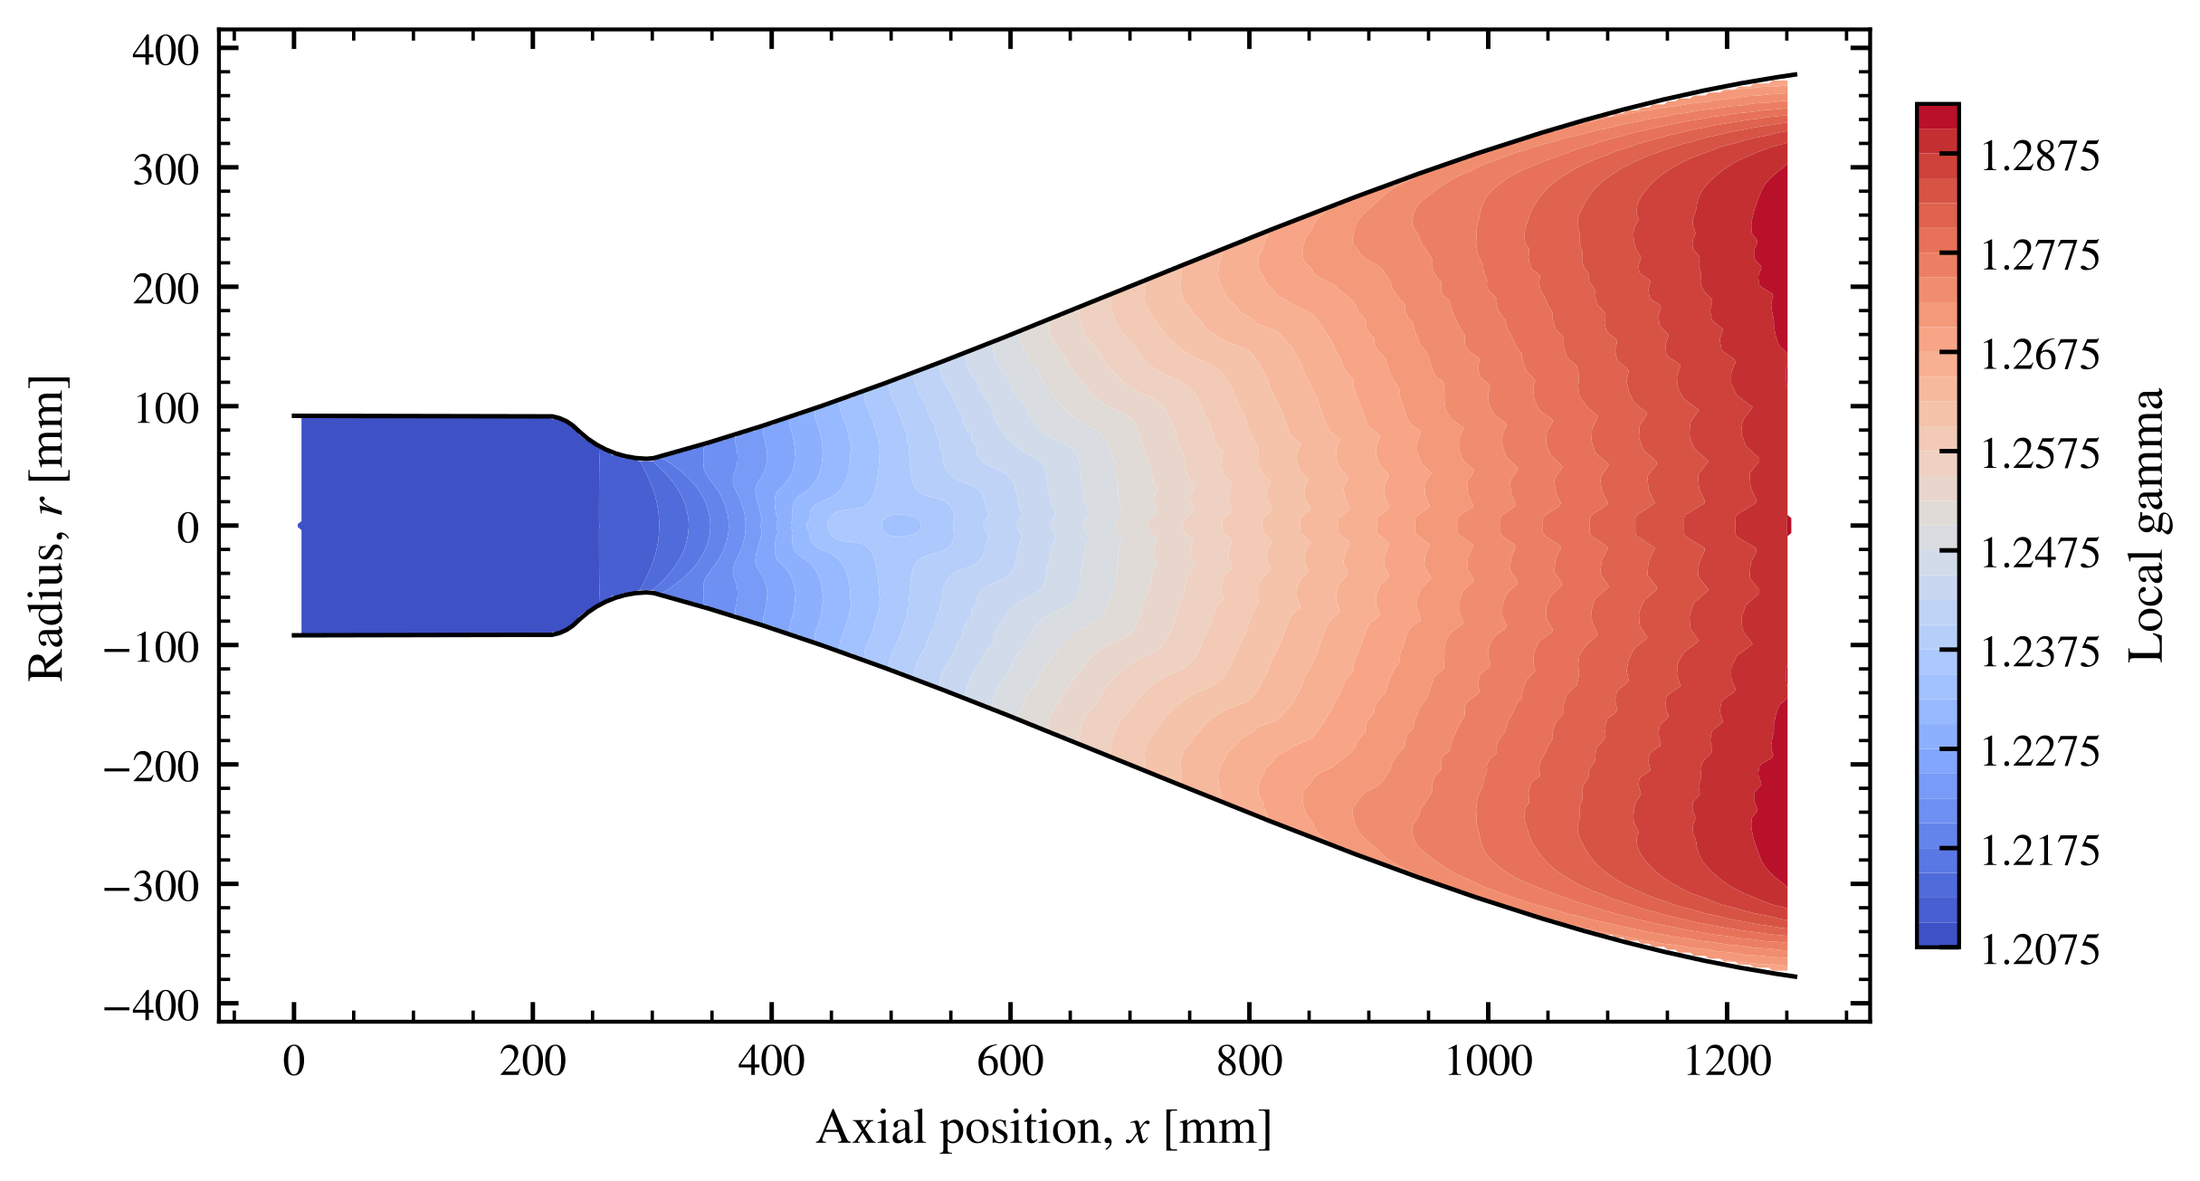
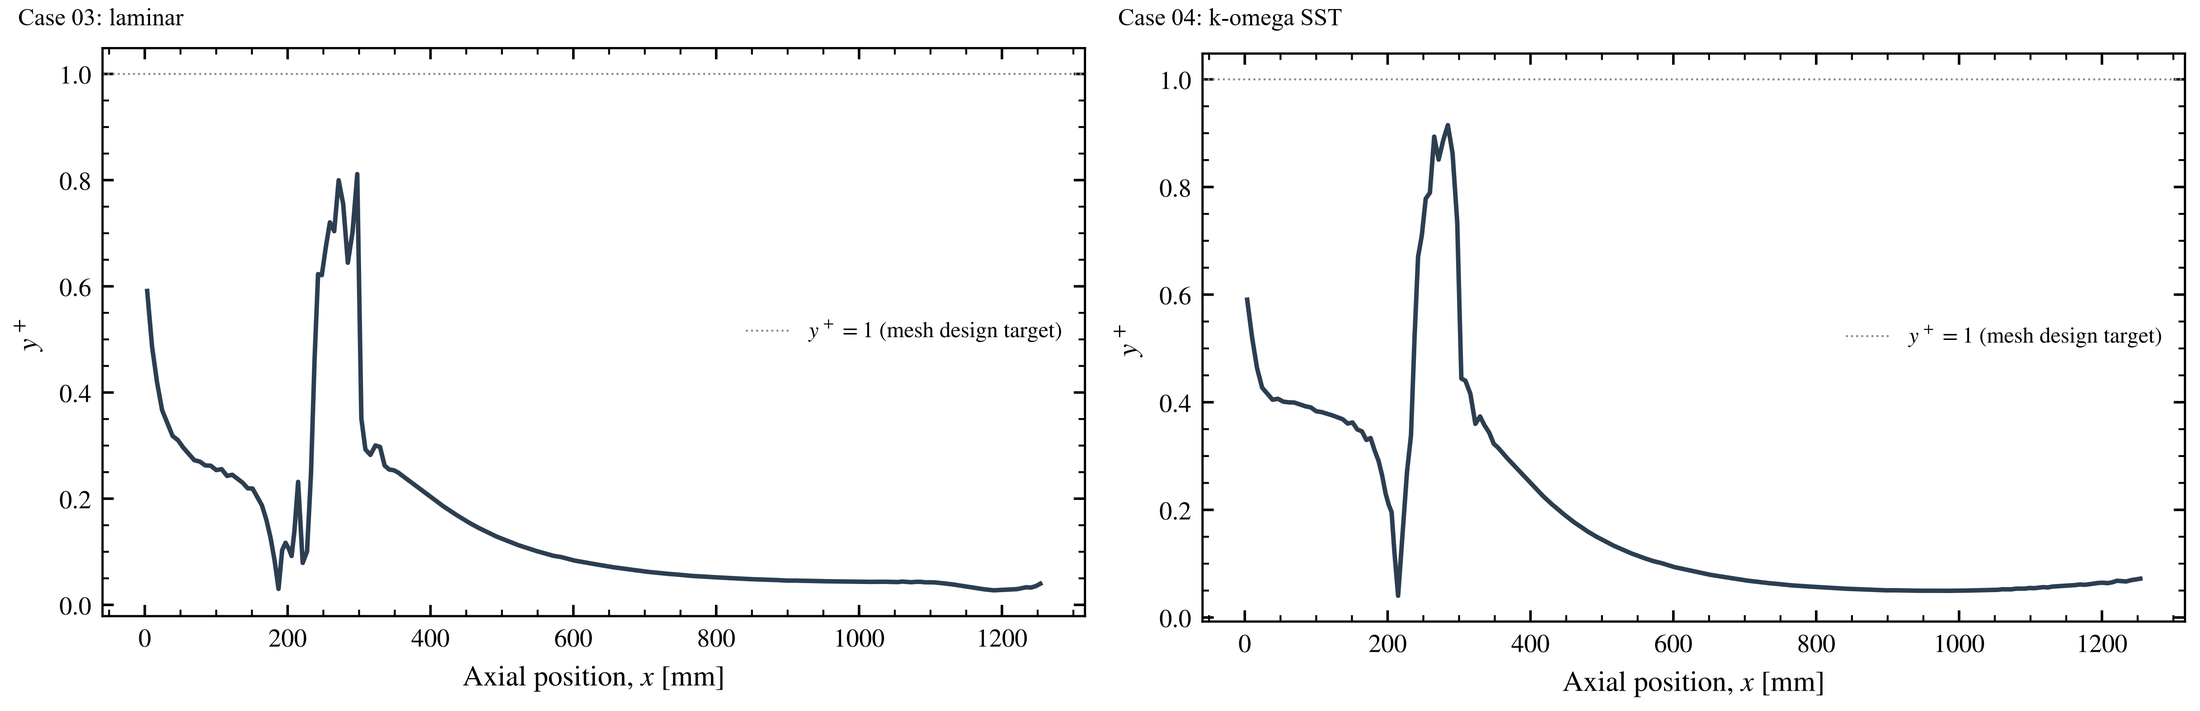
The pattern is the useful lesson. Each extra layer of physics changes the thrust by about 1%, but it changes what you can see in the flow far more. There is no grid-convergence study, so I cannot show that differences this small are larger than the discretization error. If the question is performance, the inviscid model with temperature-dependent heat capacity gets most of the way. If the question is heat load or separation, the wall physics is everything. Every step is internally consistent and conserves mass to better than 0.16%.
ResultsVacuum nozzles vs sea-level nozzles
A nozzle gives the most thrust when its exit pressure matches the surrounding pressure. That is why engines are built for where they fire. A sea-level engine has a much shorter nozzle (area ratios typically of order 10–20), so its exit pressure stays near one atmosphere. A vacuum engine like the ascent engine uses a long, wide bell (an area ratio of 45.6 here) to continue to expand the gas. This turns more of its enthalpy into exhaust velocity [2]. Run either one away from its design pressure and energy is wasted.
Thrust is maximized when \(p_e=p_a\). If \(p_e>p_a\), the flow is under-expanded. It continues to turn outward through expansion fans (Prandtl–Meyer function \(\nu(M)\)) after it leaves. If \(p_e\ll p_a\), the flow is over-expanded and the atmosphere pushes back through shocks.
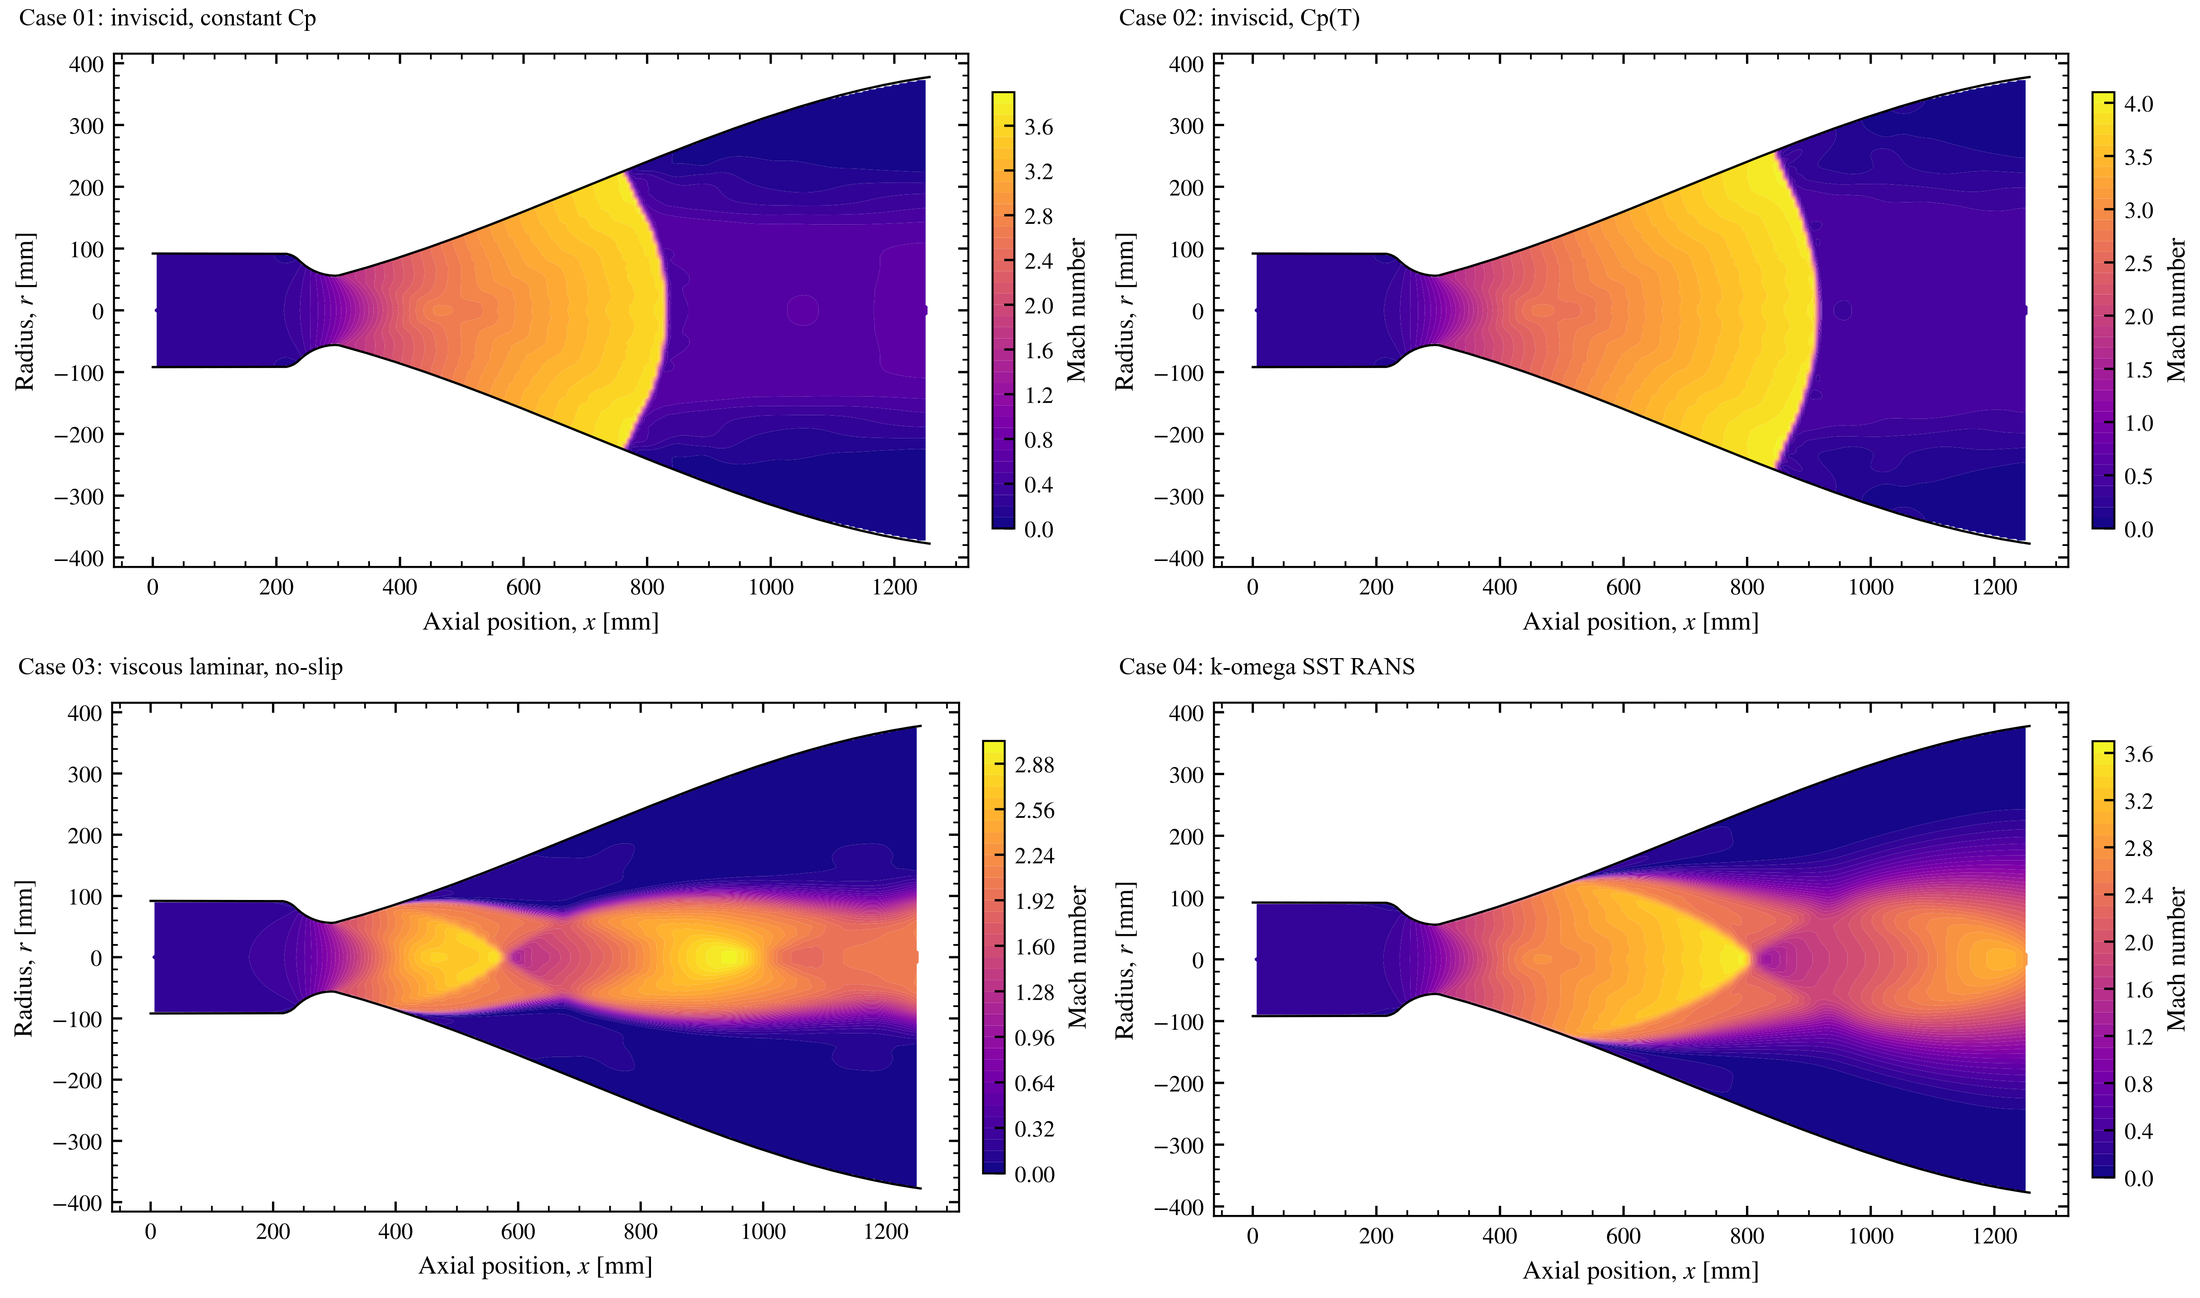
To reach the design point, I used a back-pressure ladder that lowers the outlet pressure in steps from 101 kPa to 1.45 kPa. The ladder is only a numerical path to the design point. Its first rung is sea-level back pressure. I plotted the sea-level cases on purpose, to show the over-expansion and the shocks it drives into the bell. I think the shocks and the throat expansion look cool as hell.
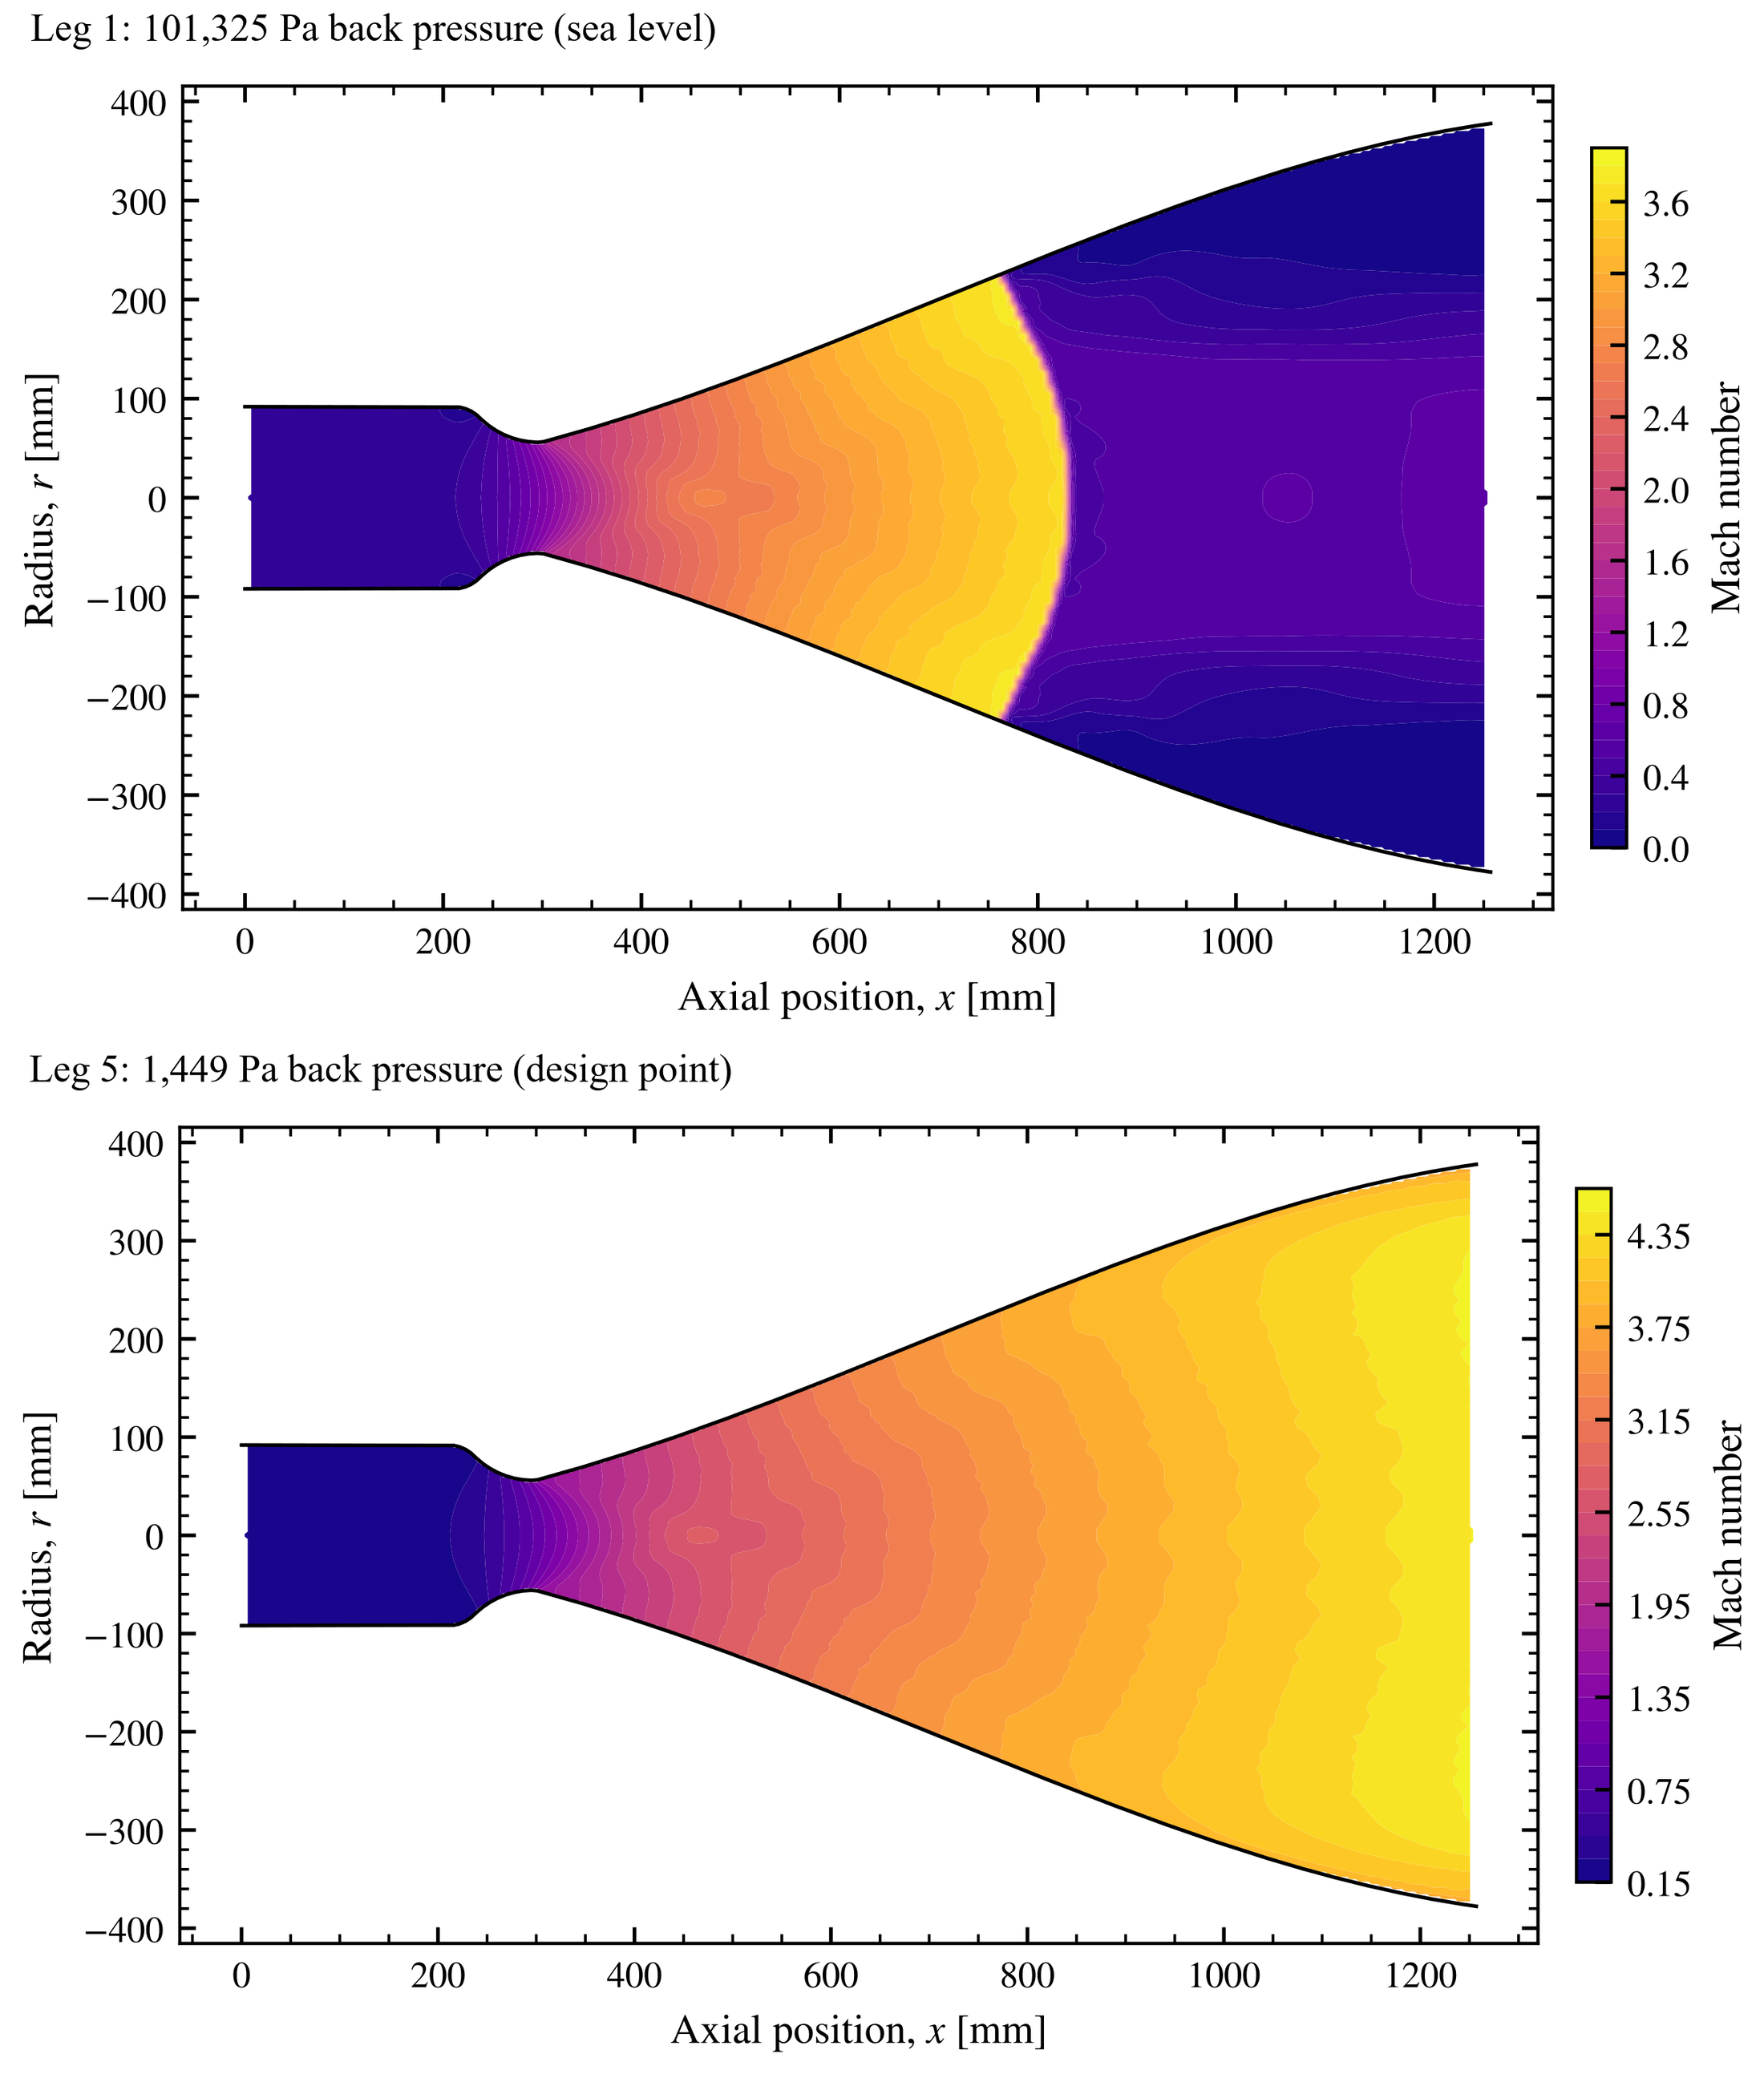
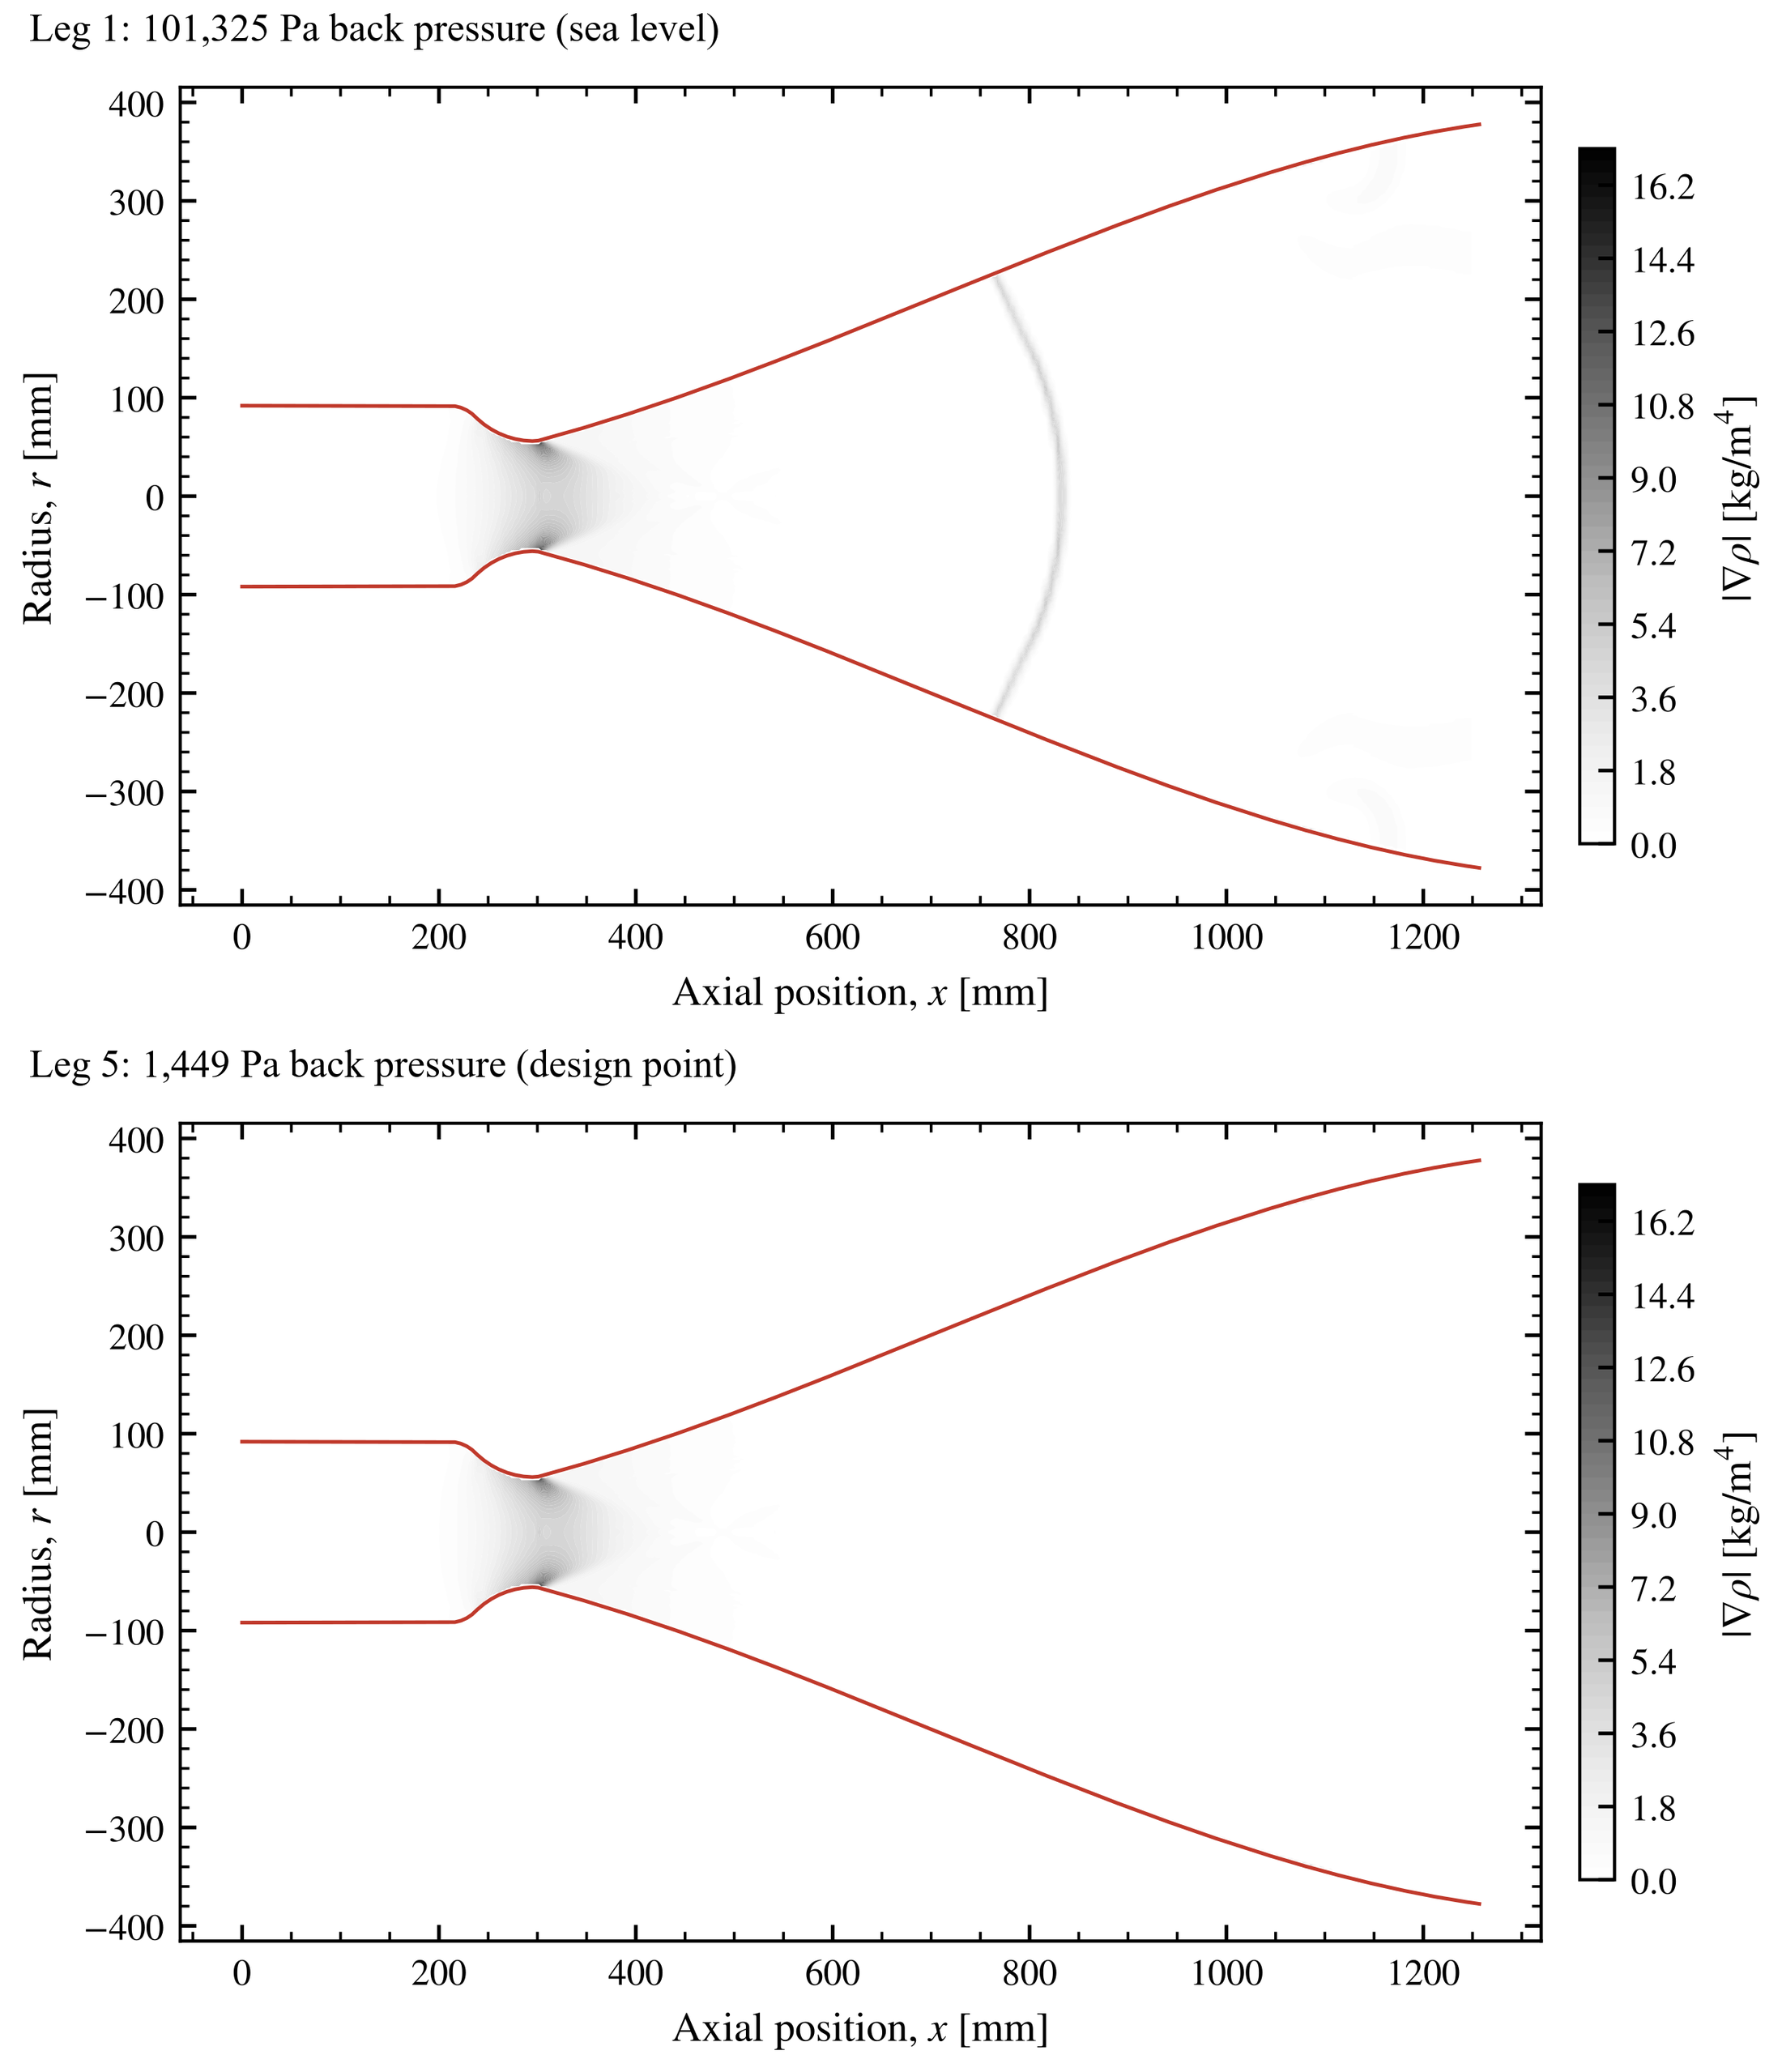
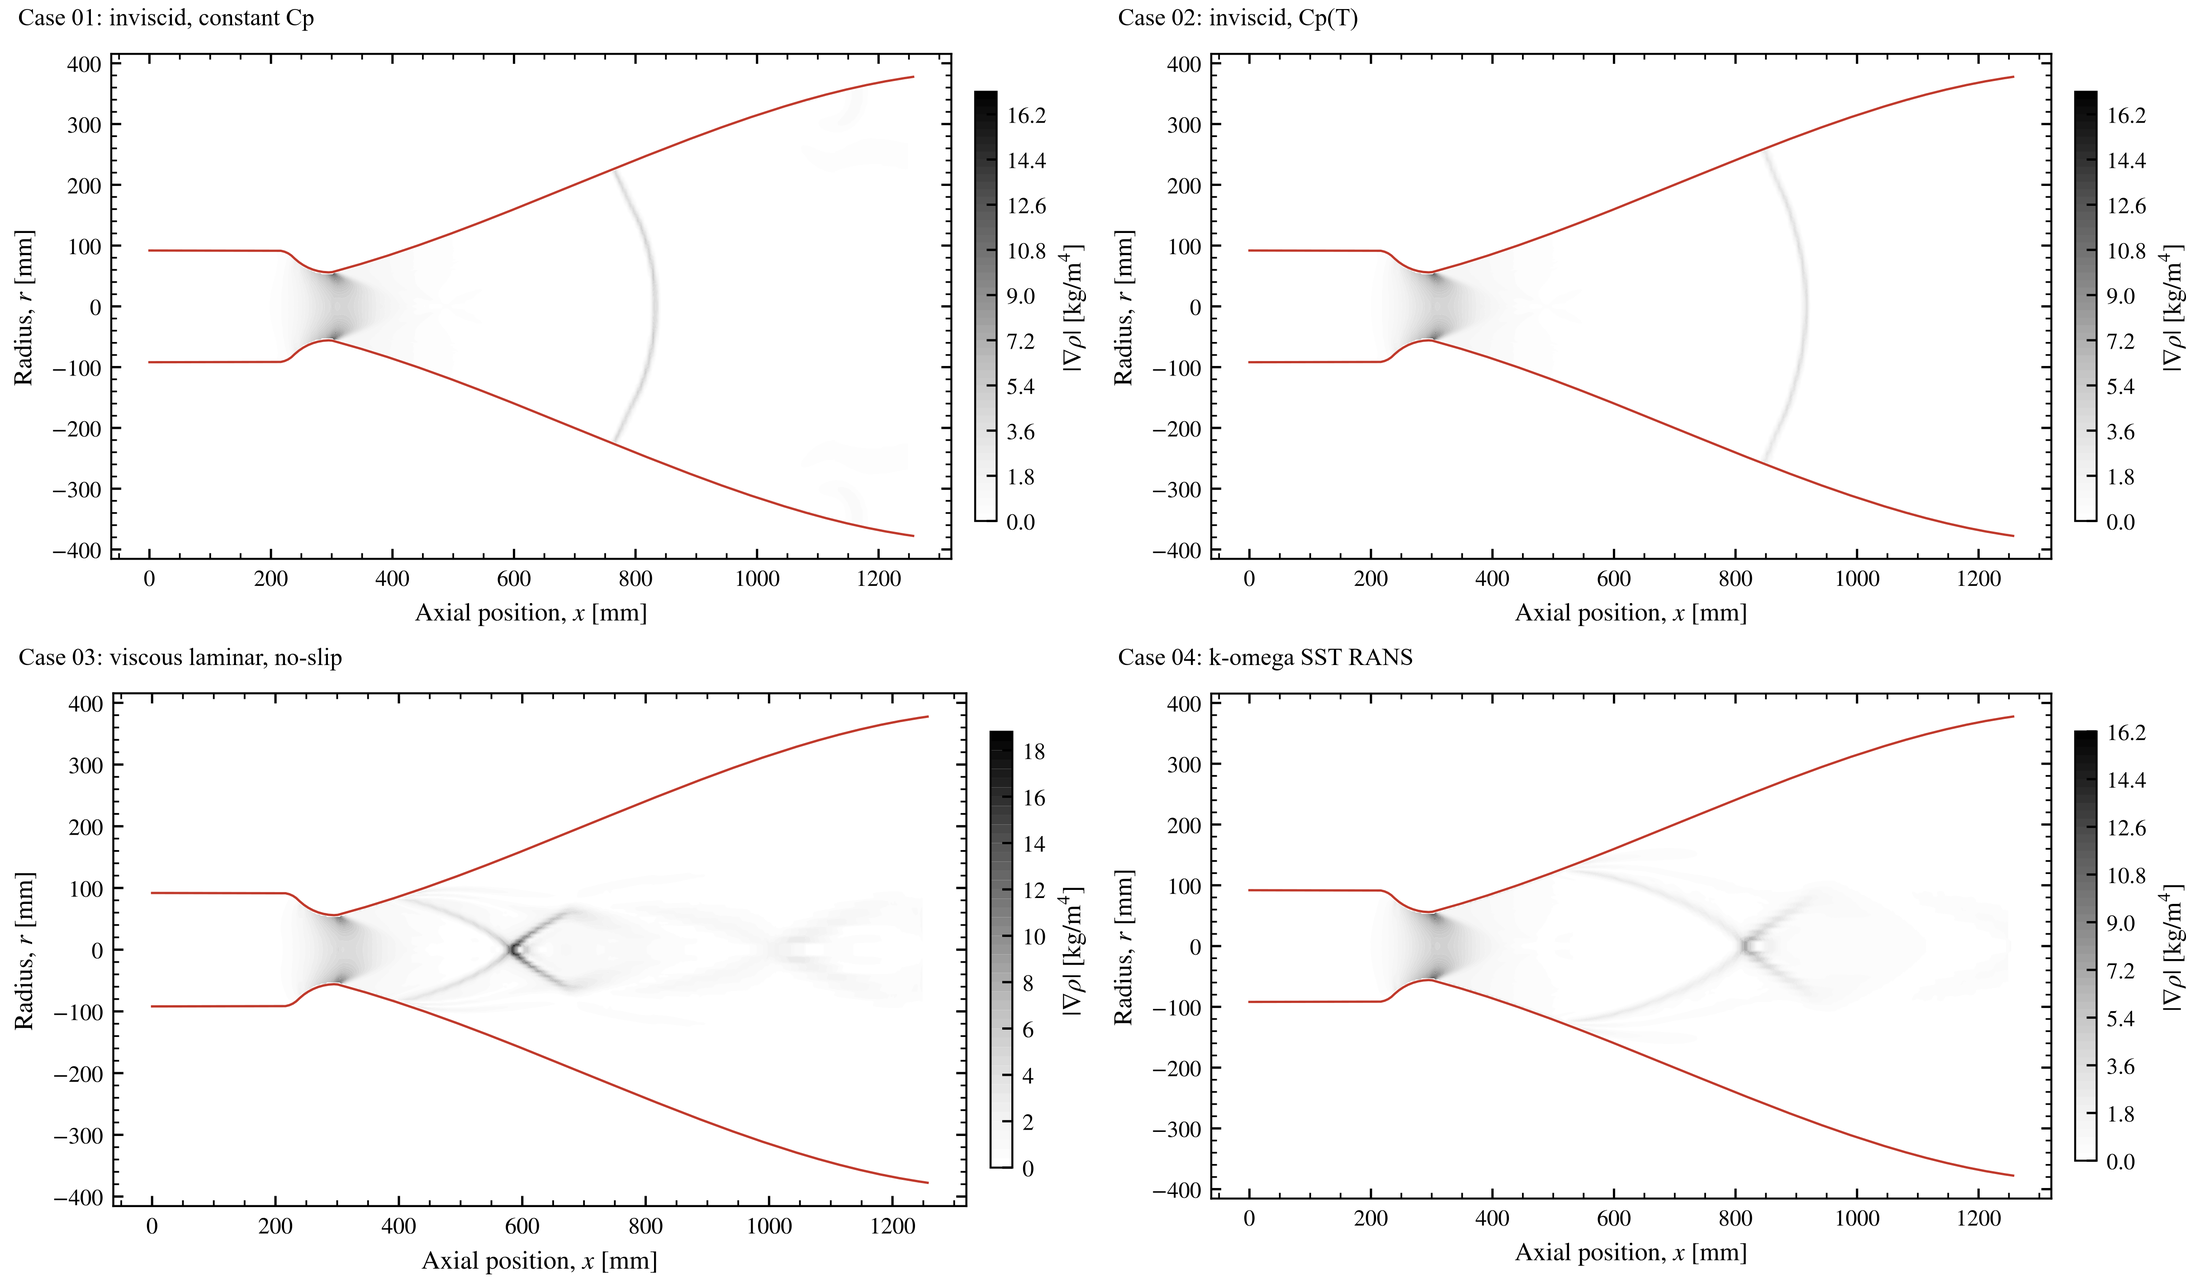
At sea level, the exit pressure of this nozzle would be about 1.7% of atmospheric pressure, so the flow is wildly over-expanded. The inviscid models answer with a single normal shock that stands in the bell. Viscosity changes the picture completely. The slow boundary layer cannot climb that pressure rise, so the jet separates from the wall. Oblique shocks then cross into a Mach disc and a chain of shock cells.
Against sea-level back pressure, this vacuum nozzle runs strongly over-expanded, with internal shocks and, in the viscous cases, separation. In this study, sea level is only the first rung of the numerical ladder. The viscous sea-level fields are not mass-converged, so I use them for the flow structure only.
| Ambient pressure | Ideal thrust | Change | Isp |
|---|---|---|---|
| 1,449 Pa (design leg) | 14,693 N | −4.2% | 319 s |
| 2.5 kPa | 14,222 N | −7.3% | 309 s |
| 8 kPa | 11,757 N | −23% | 256 s |
| 30 kPa | 1,899 N | −88% | 41 s |
| 101.3 kPa (sea level) | negative | — | — |
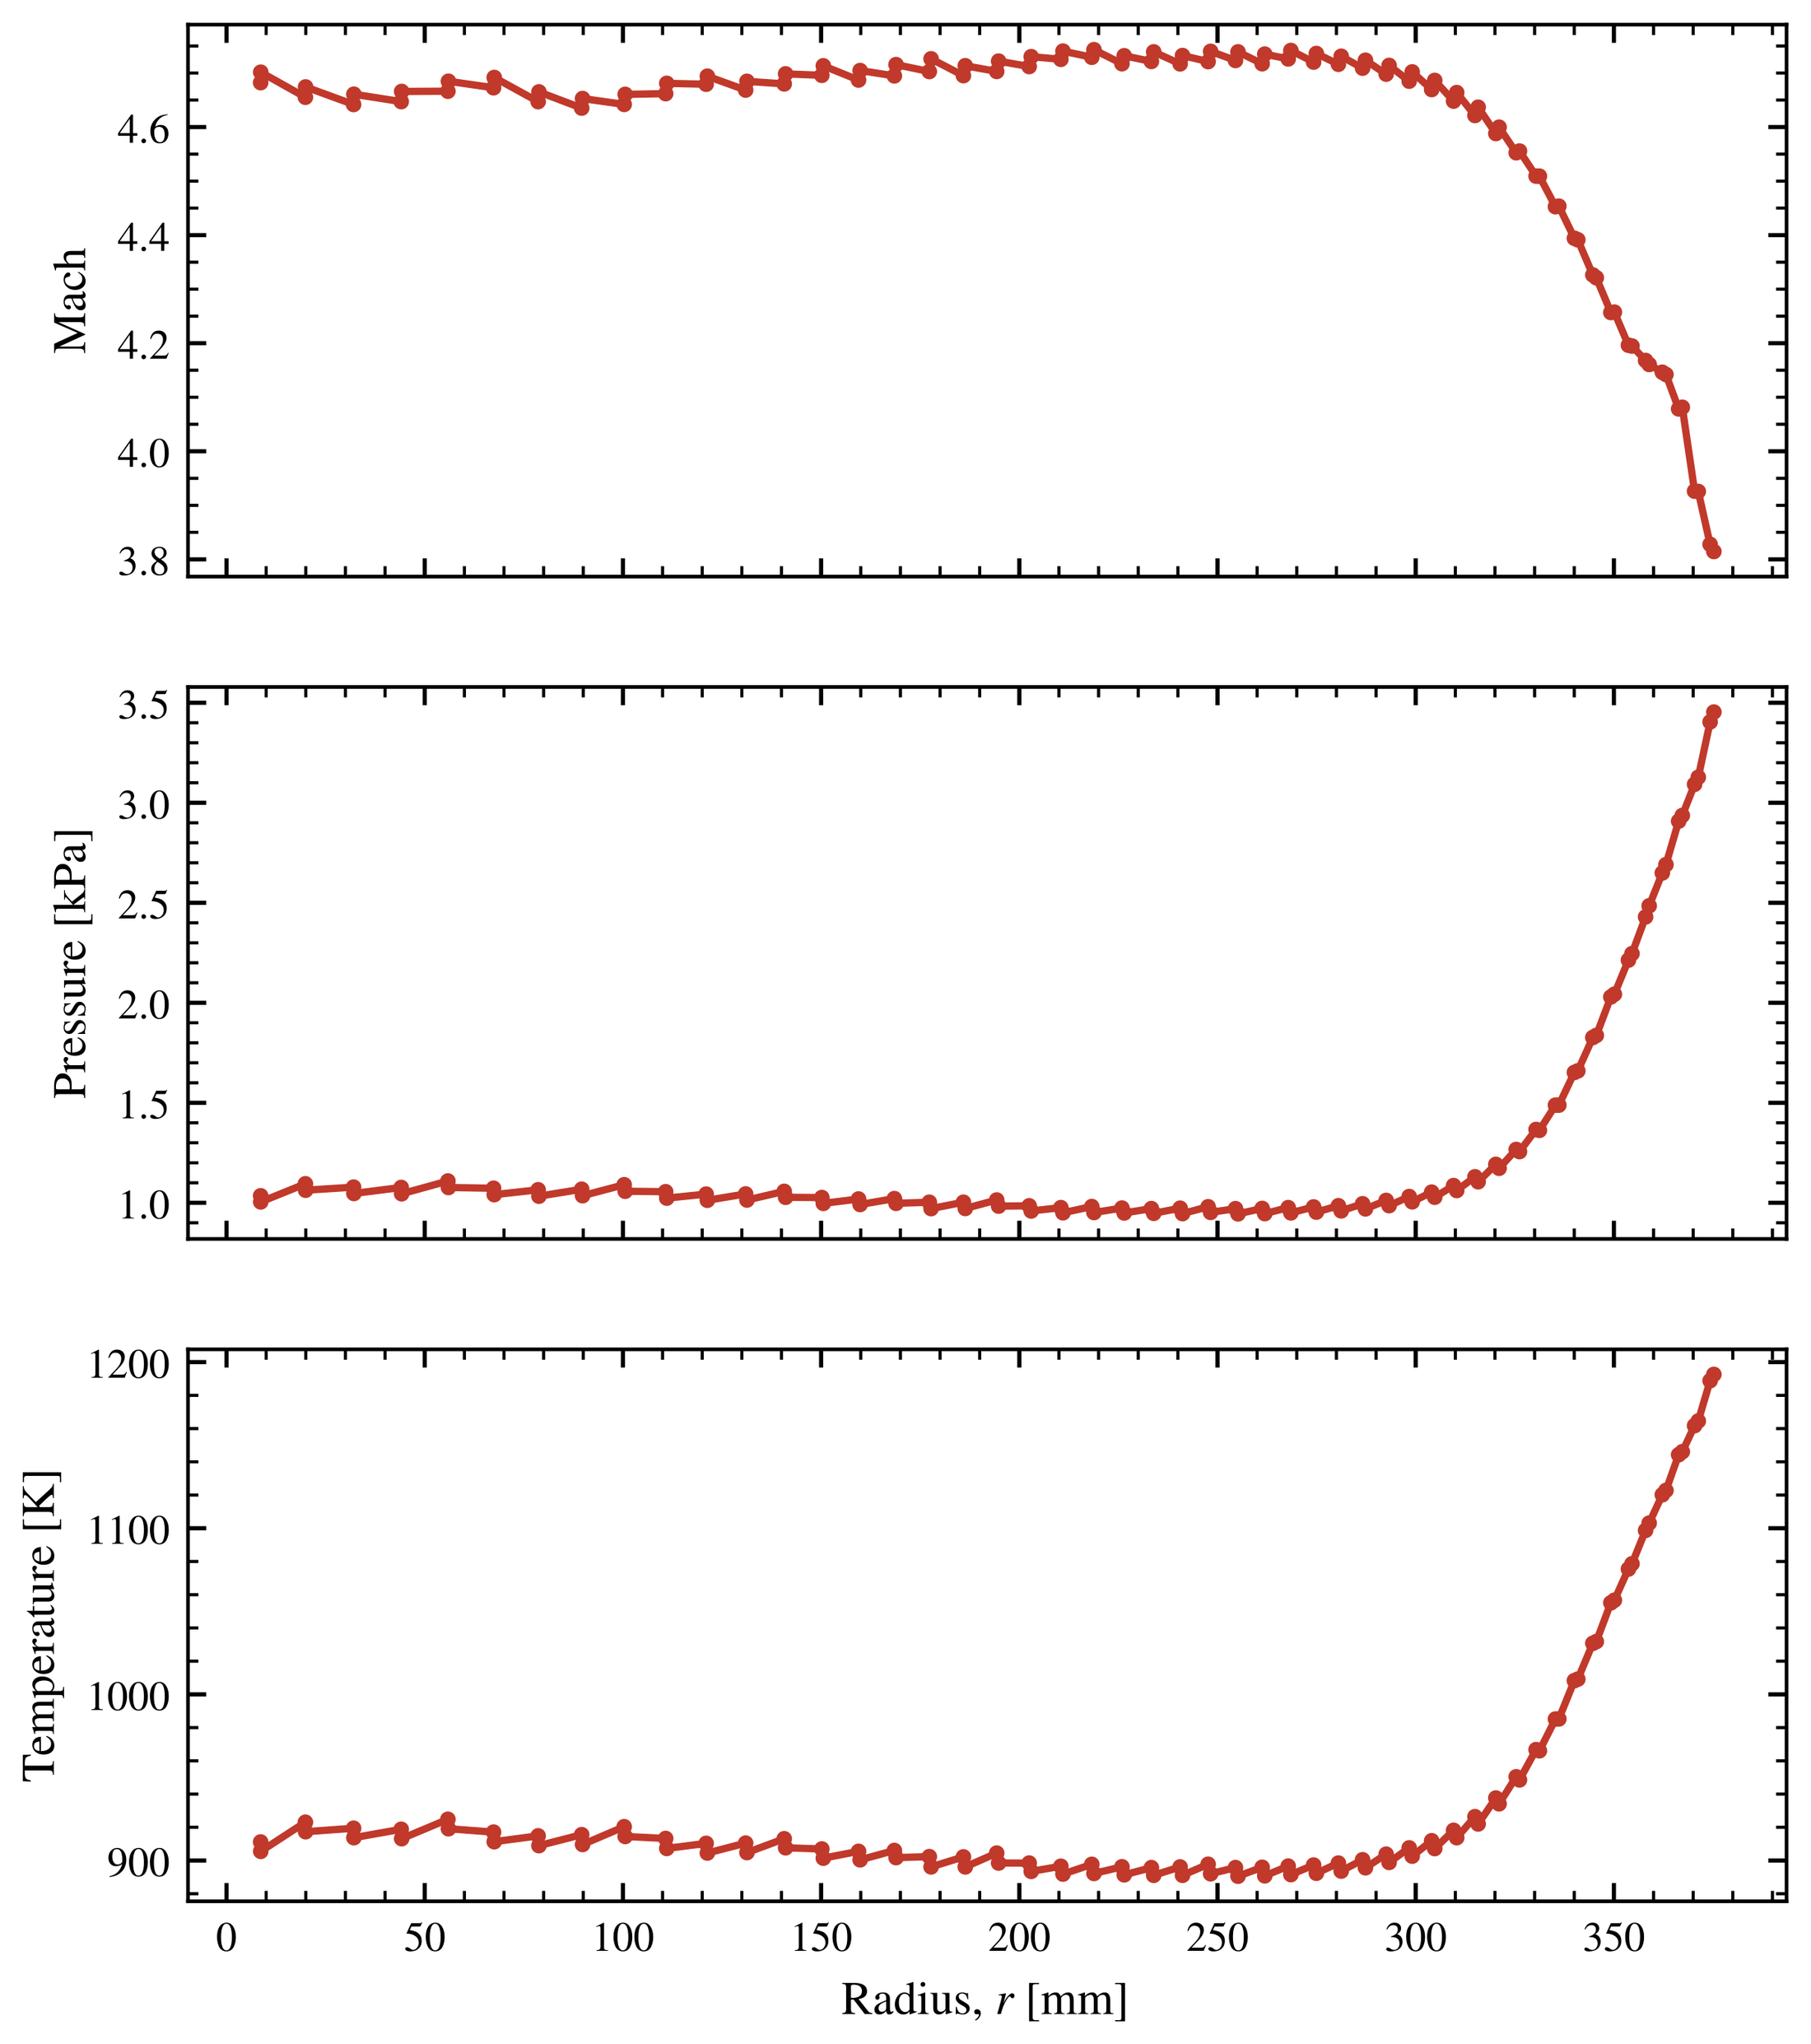
The table puts the wasted energy in numbers. Even at its own design point, the solution is slightly under-expanded. The exit pressure rises from about 1.0 kPa on the axis to 3.4 kPa at the lip, which is above the 1.45 kPa outside. The gas therefore continues to expand through fans that start at the lip, just outside the computed domain. Toward sea level, the pressure term swamps everything.
ResultsInto the plume
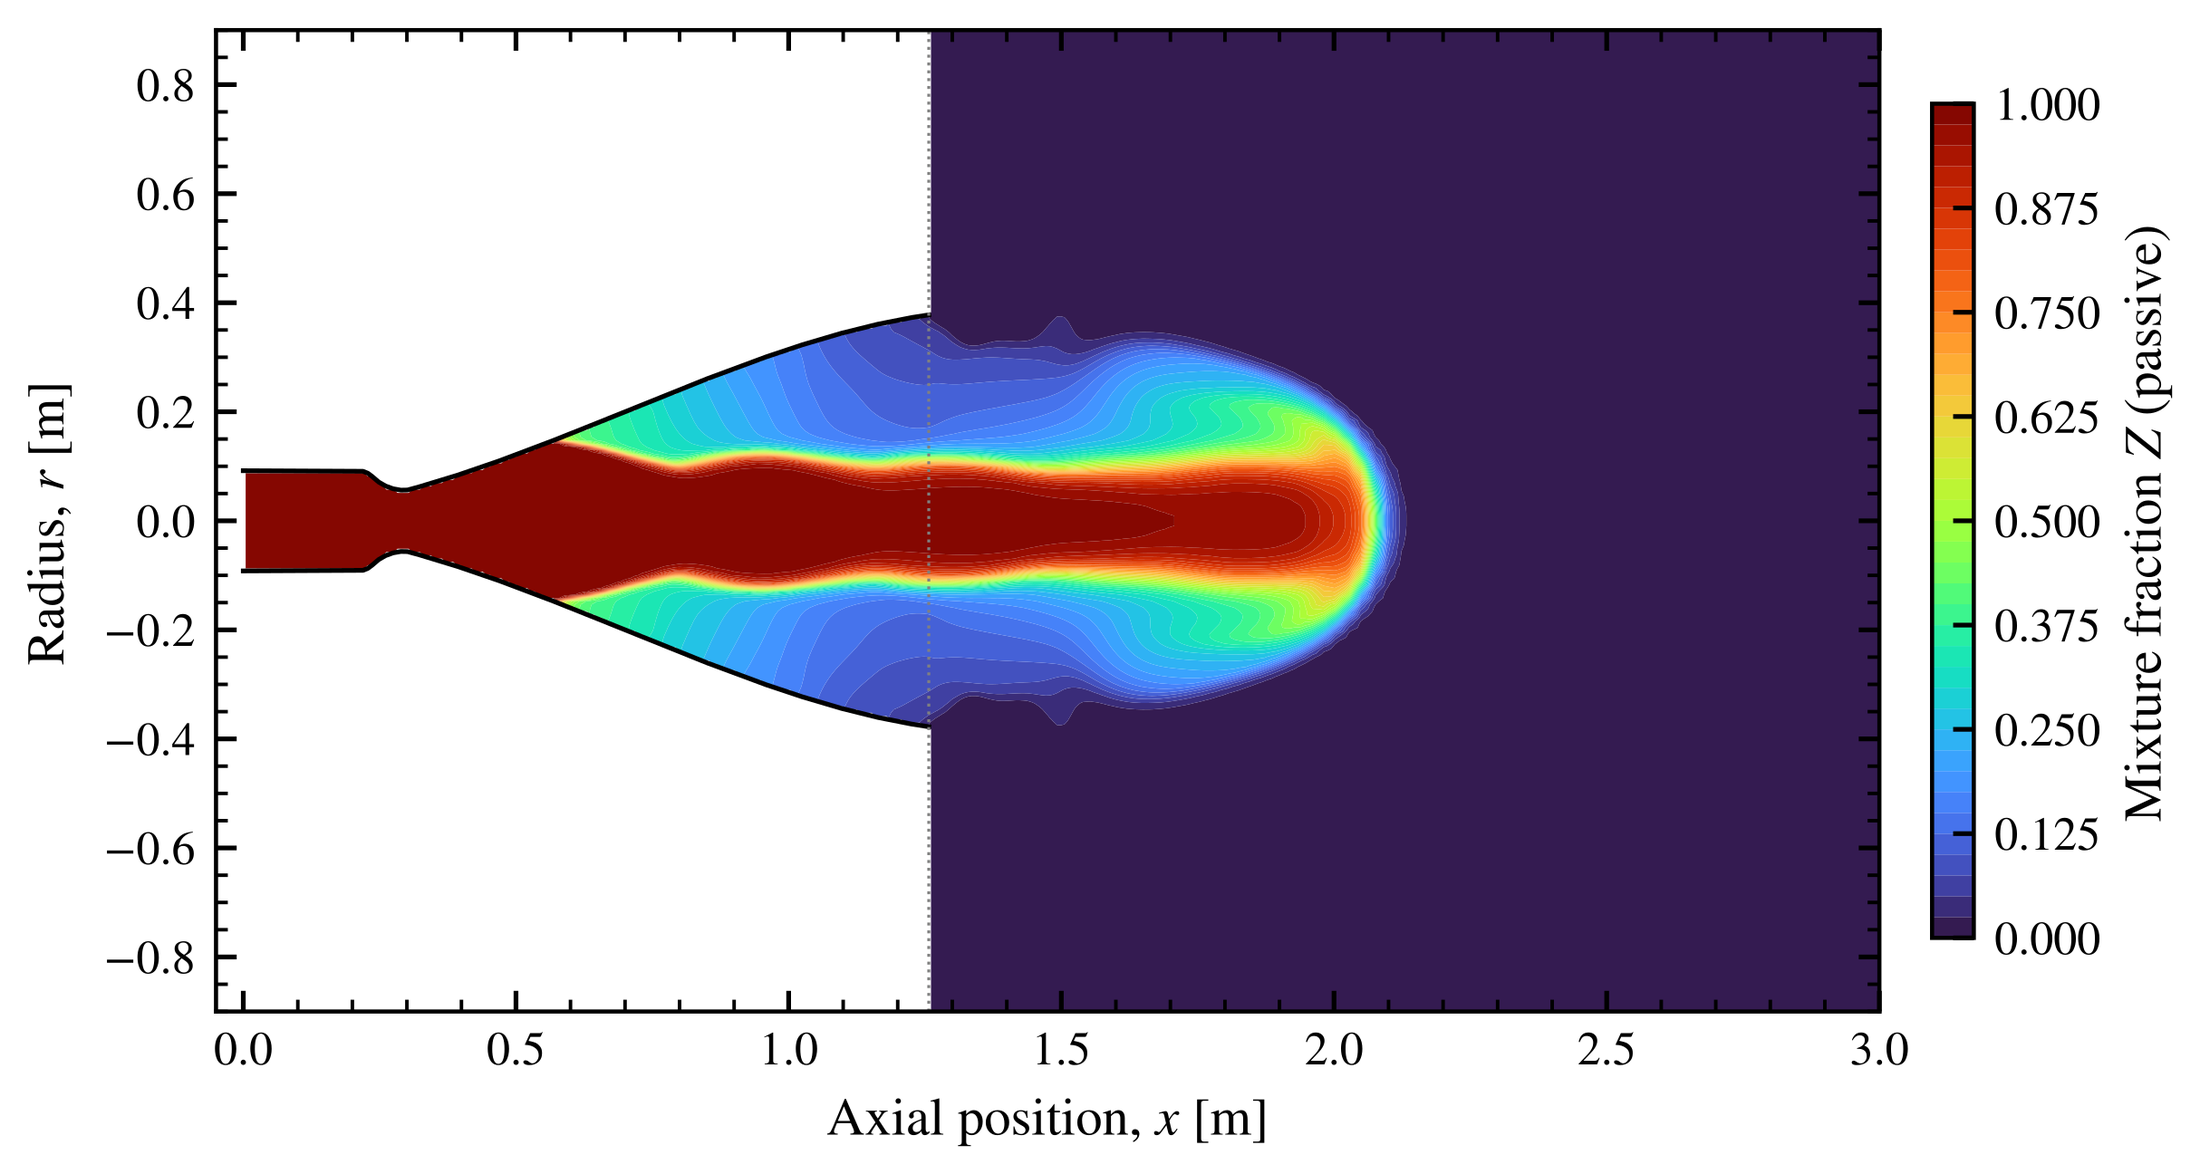
Case 05 extends the domain ten exit diameters downstream and six radially. It transports a passive mixture fraction from the nozzle into the surrounding air [8]:
Bounded passive-scalar transport with a turbulent Schmidt number of one. \(Z=1\) is nozzle gas and \(Z=0\) is ambient air.
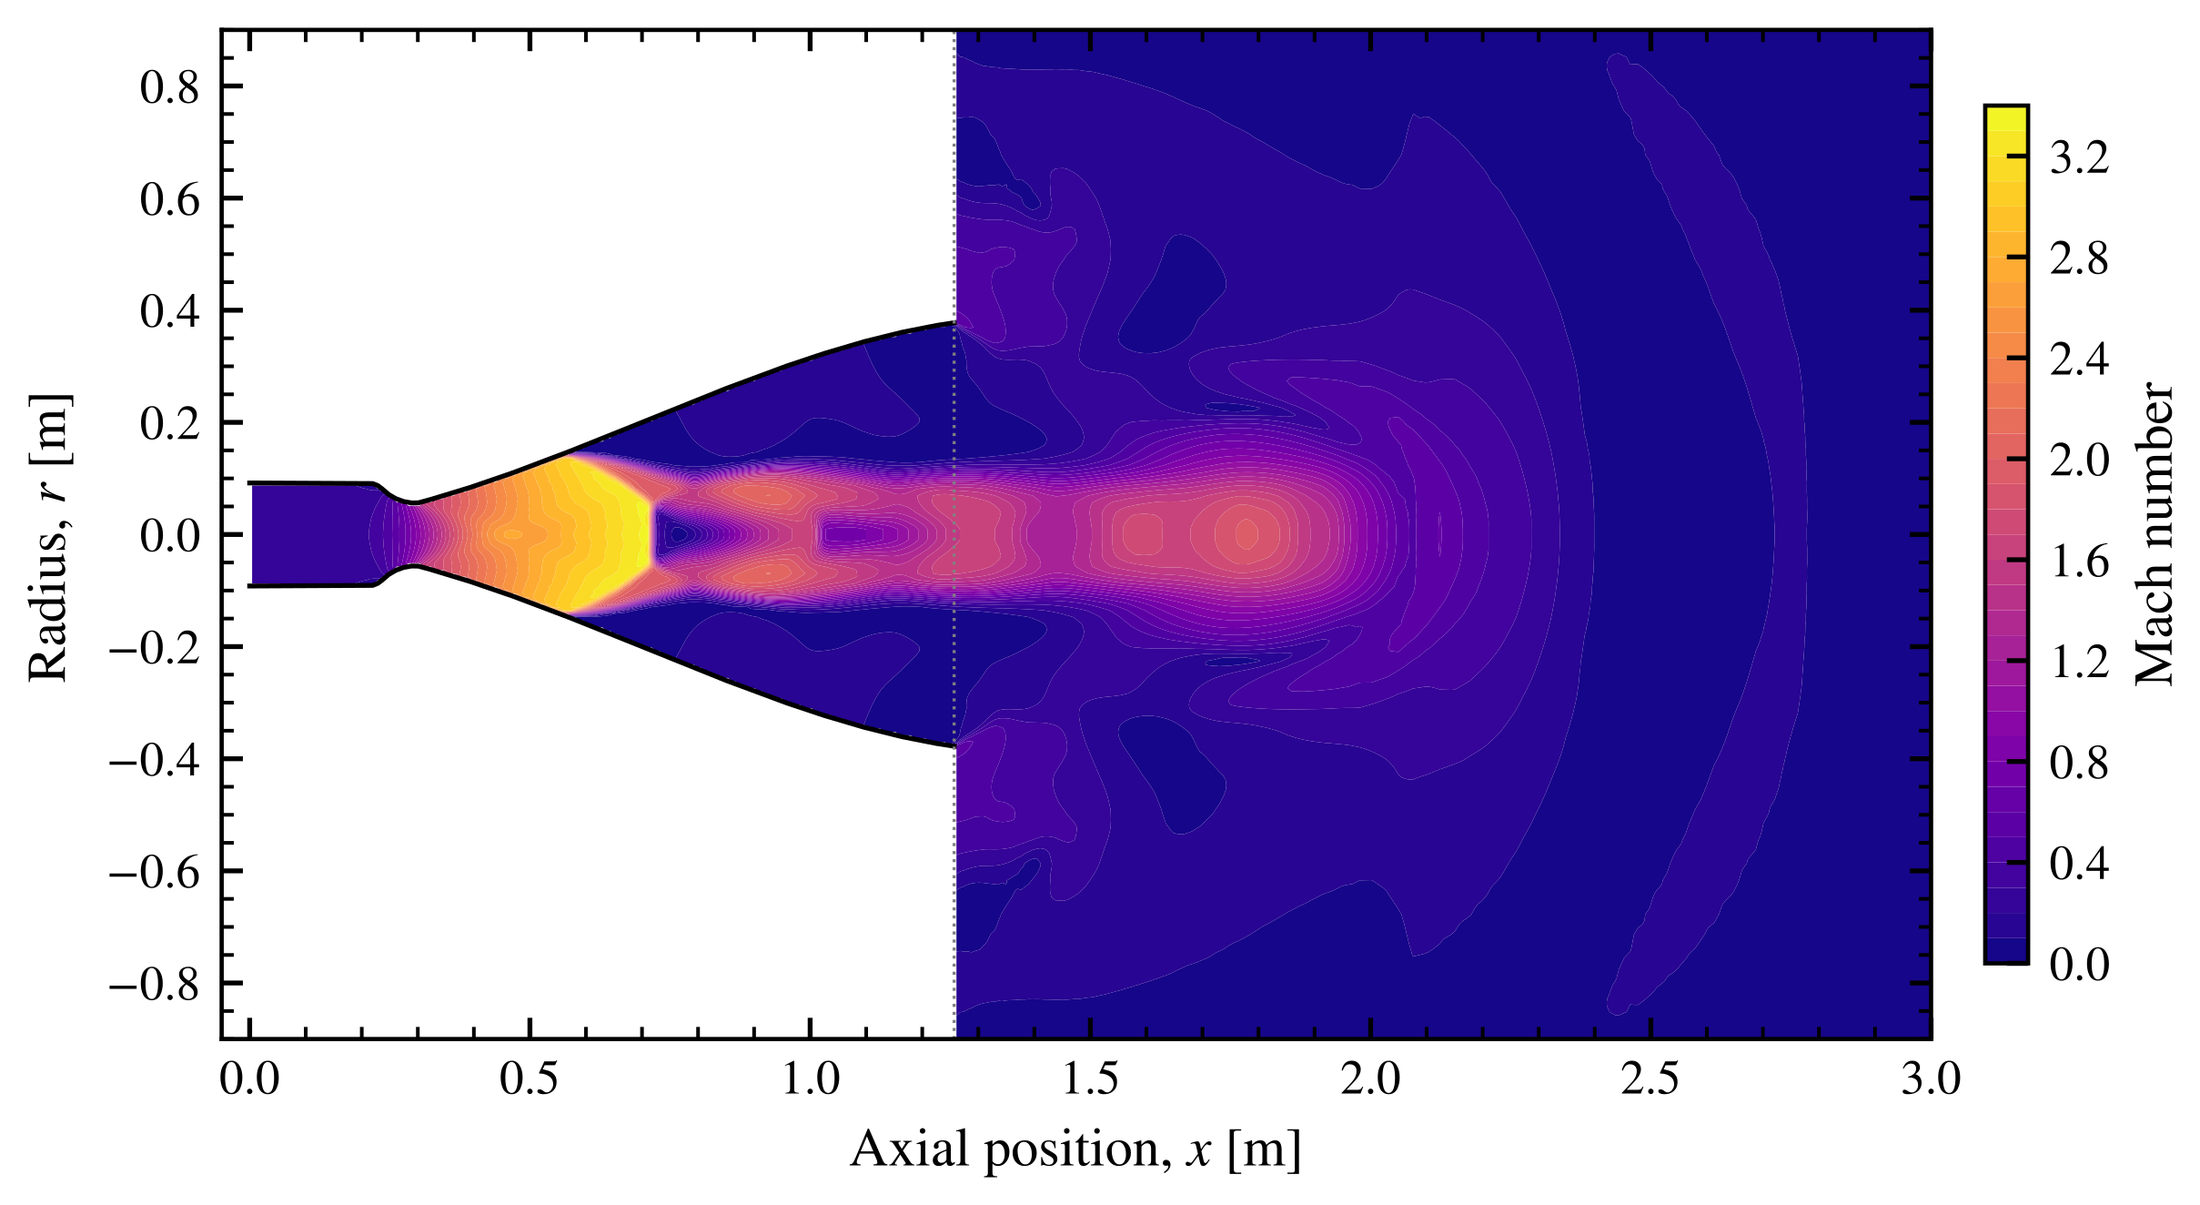
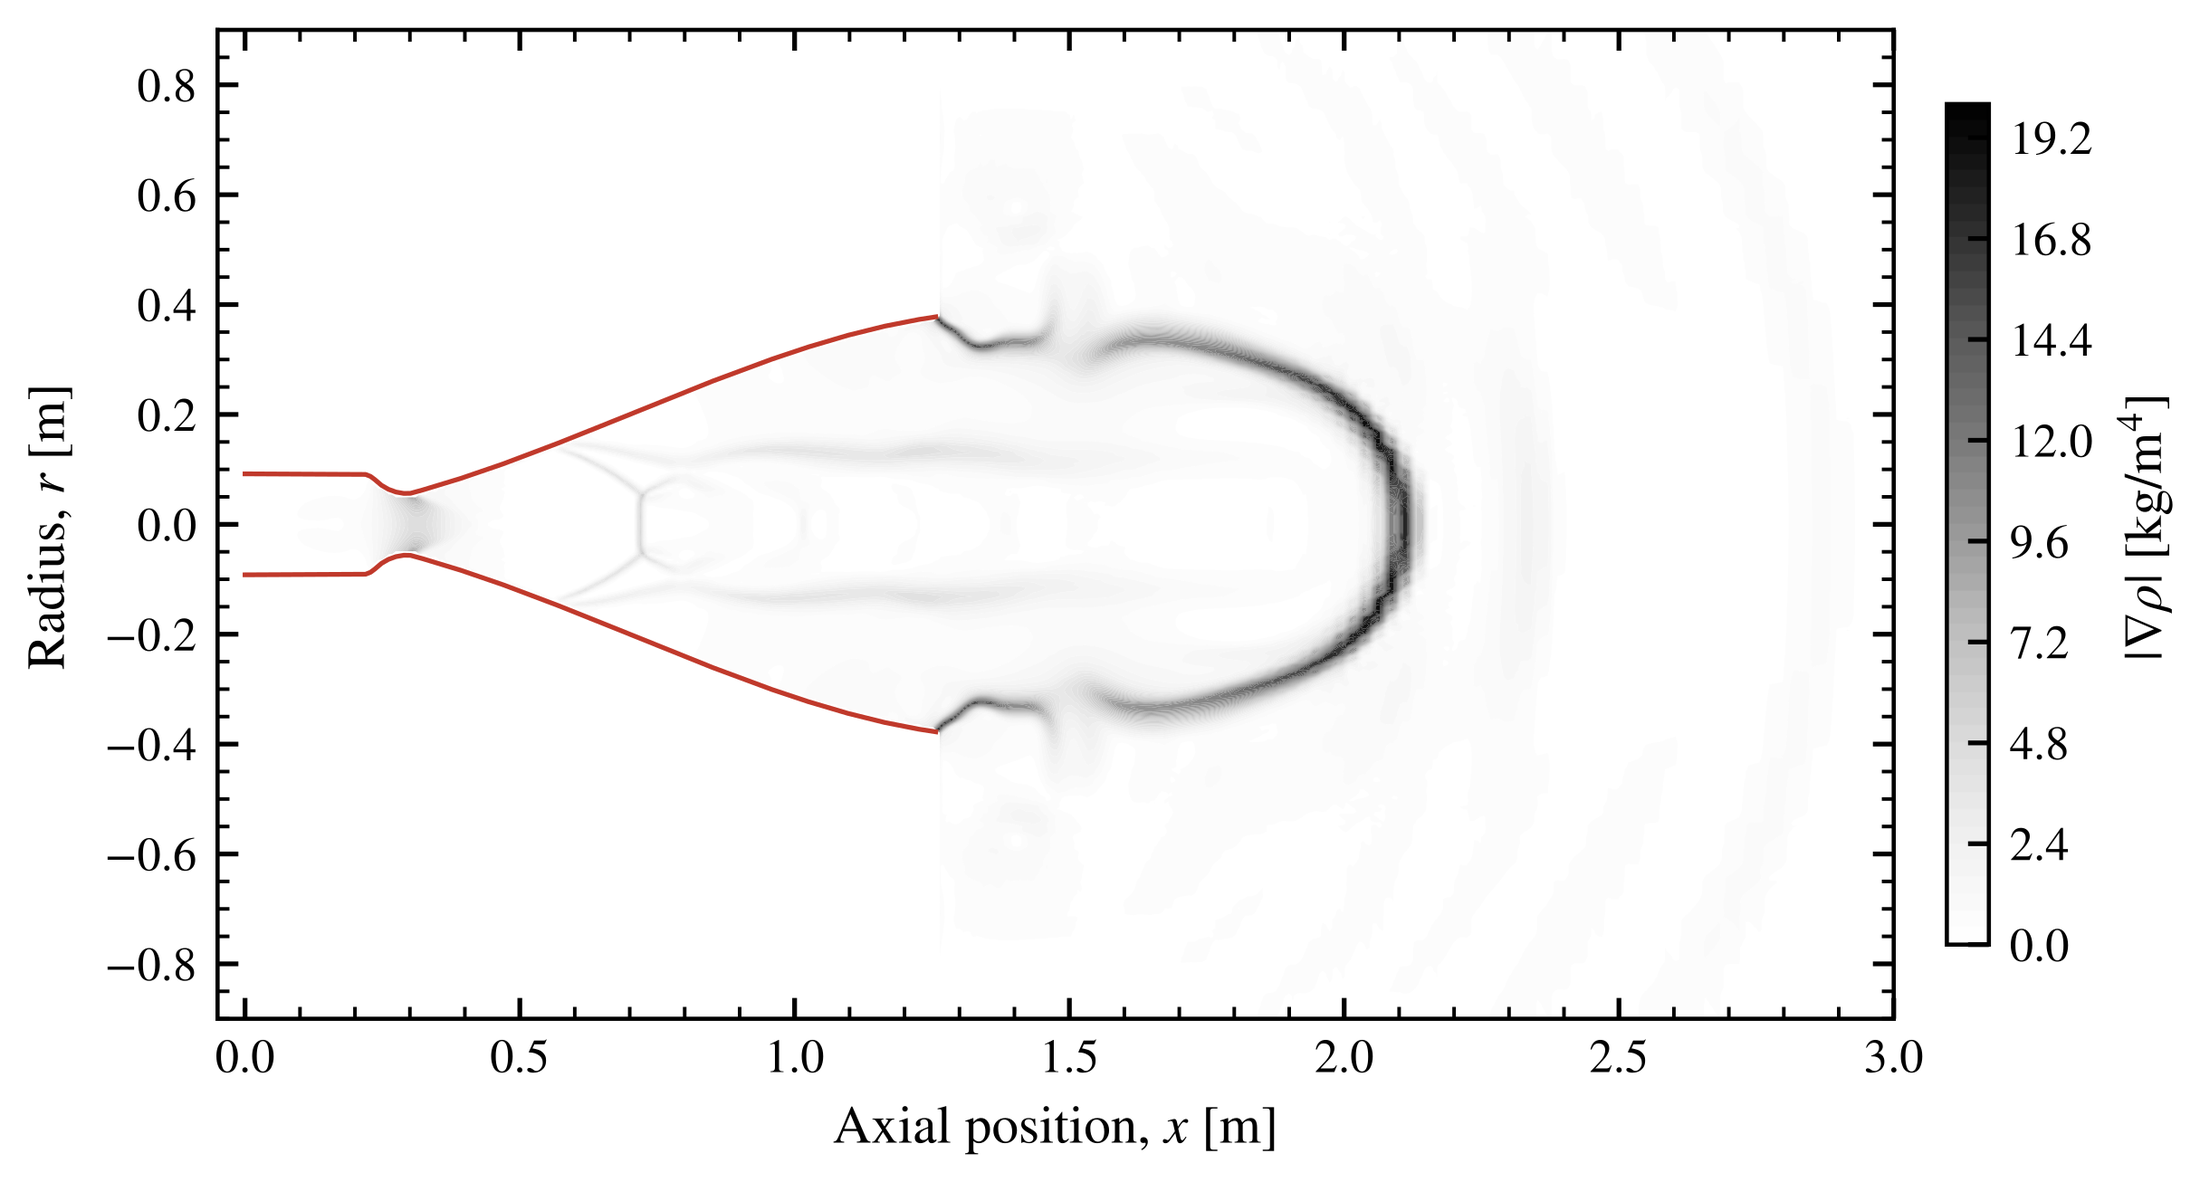
I tracked where Z = 0.5 crosses the axis. After 5 to 6.5 ms, the front was only 1.05 to 1.80 exit diameters past the lip. It advanced at about 377 m/s, against roughly 2,900 m/s inside the duct. This is the early starting jet, before a plume develops.
A physical diagnostic caught what the residuals did not. Each leg simulated only half a millisecond, but a pressure wave needs about 20 ms to cross from the far-field boundary. As a result, the lower ambient pressures never reached the jet. The same case also produced a 778 GB log that filled the disk and crashed the virtual machine. The cause was an over-hot initial condition that exceeded the 3,600 K limit of the thermodynamic fit on every step. Both were worth learning the hard way.
References
- [1]J. C. Hooper III, Performance Analysis of the Ascent Propulsion System of the Apollo Spacecraft, NASA TN D-7400, 1973; C. E. Humphries and R. E. Taylor, Apollo Experience Report: Ascent Propulsion System, NASA TN D-7082, 1973. (Engine background and operating point.)
- [2]G. P. Sutton and O. Biblarz, Rocket Propulsion Elements, 9th ed., Wiley, 2017.
- [3]J. D. Anderson, Modern Compressible Flow with Historical Perspective, 3rd ed., McGraw-Hill, 2003.
- [4]C. J. Greenshields, H. G. Weller, L. Gasparini and J. M. Reese, “Implementation of semi-discrete, non-staggered central schemes in a colocated, polyhedral, finite volume framework, for high-speed viscous flows,” Int. J. Numer. Methods Fluids 63, 1–21, 2010.
- [5]A. Kurganov and E. Tadmor, “New high-resolution central schemes for nonlinear conservation laws and convection–diffusion equations,” J. Comput. Phys. 160, 241–282, 2000.
- [6]F. R. Menter, “Two-equation eddy-viscosity turbulence models for engineering applications,” AIAA J. 32, 1598–1605, 1994.
- [7]T. J. Poinsot and S. K. Lele, “Boundary conditions for direct simulations of compressible viscous flows,” J. Comput. Phys. 101, 104–129, 1992.
- [8]J. S. Turner, “The ‘starting plume’ in neutral surroundings,” J. Fluid Mech. 13, 356–368, 1962.
- [9]D. G. Goodwin, H. K. Moffat, I. Schoegl, R. L. Speth and B. W. Weber, Cantera, v3.0, 2023.